Albertsons 2005 Annual Report Download - page 53
Download and view the complete annual report
Please find page 53 of the 2005 Albertsons annual report below. You can navigate through the pages in the report by either clicking on the pages listed below, or by using the keyword search tool below to find specific information within the annual report.-
 1
1 -
2
-
3
-
4
-
5
-
6
-
7
-
8
-
9
-
10
-
11
-
12
-
13
-
14
-
15
-
16
-
17
-
18
-
19
-
20
-
21
-
22
-
23
-
24
-
25
-
26
-
27
-
28
-
29
-
30
-
31
-
32
-
33
-
34
-
35
-
36
-
37
-
38
-
39
-
40
-
41
-
42
-
 43
43 -
 44
44 -
 45
45 -
 46
46 -
 47
47 -
 48
48 -
 49
49 -
 50
50 -
 51
51 -
 52
52 -
 53
53 -
 54
54 -
 55
55 -
 56
56 -
 57
57 -
 58
58 -
 59
59 -
 60
60 -
 61
61 -
 62
62 -
 63
63 -
64
-
65
-
66
-
67
-
68
-
69
-
70
-
71
-
72
-
73
-
74
-
75
-
76
-
77
-
78
-
79
-
80
-
81
-
82
-
83
-
84
-
85
-
86
-
87
-
88
 |
 |

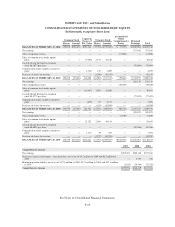
SUPERVALU INC. and Subsidiaries
CONSOLIDATED COMPOSITION OF NET SALES AND OPERATING EARNINGS
(In thousands, except percent data)
February 26, 2005
(52 weeks)
February 28, 2004
(53 weeks)
February 22, 2003
(52 weeks)
Net sales
Retail food $10,549,478 $10,551,235 $ 9,848,230
54.0% 52.2% 51.4%
Food distribution 8,993,762 9,658,444 9,312,138
46.0% 47.8% 48.6%
Total net sales $19,543,240 $20,209,679 $19,160,368
100.0% 100.0% 100.0%
Operating earnings
Retail food operating earnings $ 446,303 $ 443,968 $ 436,537
Food distribution operating earnings 234,585 222,462 171,589
General corporate expenses (48,064) (49,509) (35,265)
Gain on sale of WinCo Foods, Inc. 109,238 — —
Restructure and other charges (26,416) (15,523) (2,918)
Total operating earnings 715,646 601,398 569,943
Interest expense, net (114,782) (146,518) (161,939)
Earnings before income taxes $ 600,864 $ 454,880 $ 408,004
Identifiable assets
Retail food $ 3,269,793 $ 3,448,117 $ 3,352,164
Food distribution 2,554,915 2,440,692 2,527,858
Corporate 453,634 272,962 16,223
Total $ 6,278,342 $ 6,161,771 $ 5,896,245
Depreciation and amortization
Retail food $ 207,523 $ 200,367 $ 184,619
Food distribution 94,943 99,322 109,566
Corporate 573 1,900 2,871
Total $ 303,039 $ 301,589 $ 297,056
Capital expenditures
Retail food $ 219,069 $ 304,774 $ 357,342
Food distribution 105,435 65,878 80,916
Corporate 1,184 812 1,180
Total $ 325,688 $ 371,464 $ 439,438
The company’s business is classified by management into two reportable segments: Retail food and Food
distribution. Retail food operations include three retail formats: extreme value stores, regional price superstores
and regional supermarkets. The retail formats include results of food stores owned and results of sales to extreme
value stores licensed by the company. Food distribution operations include results of sales to affiliated food
stores, mass merchants and other customers, and other logistics arrangements. Substantially all of the company’s
operations are domestic. Management utilizes more than one measurement and multiple views of data to assess
segment performance and to allocate resources to the segments. However, the dominant measurements are
consistent with the consolidated financial statements.
F-7