Albertsons 2005 Annual Report Download - page 18
Download and view the complete annual report
Please find page 18 of the 2005 Albertsons annual report below. You can navigate through the pages in the report by either clicking on the pages listed below, or by using the keyword search tool below to find specific information within the annual report.-
 1
1 -
2
-
3
-
4
-
5
-
6
-
7
-
 8
8 -
 9
9 -
 10
10 -
 11
11 -
 12
12 -
 13
13 -
 14
14 -
 15
15 -
 16
16 -
 17
17 -
 18
18 -
 19
19 -
 20
20 -
 21
21 -
 22
22 -
 23
23 -
 24
24 -
 25
25 -
 26
26 -
 27
27 -
 28
28 -
29
-
30
-
31
-
32
-
33
-
34
-
35
-
36
-
37
-
38
-
39
-
40
-
41
-
42
-
43
-
44
-
45
-
46
-
47
-
48
-
49
-
50
-
51
-
52
-
53
-
54
-
55
-
56
-
57
-
58
-
59
-
60
-
61
-
62
-
63
-
64
-
65
-
66
-
67
-
68
-
69
-
70
-
71
-
72
-
73
-
74
-
75
-
76
-
77
-
78
-
79
-
80
-
81
-
82
-
83
-
84
-
85
-
86
-
87
-
88
 |
 |
Net Earnings
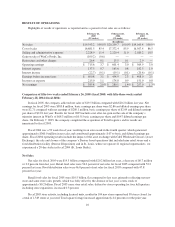
Net earnings were $385.8 million, or $2.86 per basic share and $2.71 per diluted share, in fiscal 2005
compared with net earnings of $280.1 million, or $2.09 per basic share and $2.01 per diluted share last year.
Results for fiscal 2005 include a net after-tax gain on the sale of the company’s minority interest in WinCo of
$68.3 million or $0.51 basic earnings per share and $0.47 diluted earnings per share.
Weighted average basic shares increased to 135.0 million in fiscal 2005 compared to 134.0 million in fiscal
2004 and weighted average diluted shares increased to 144.9 million in fiscal 2005 compared with 143.2 million
shares last year, reflecting the net impact of stock option activity and shares repurchased under the treasury stock
program.
Comparison of fifty-three weeks ended February 28, 2004 (fiscal 2004) with fifty-two weeks ended
February 22, 2003 (fiscal 2003):
In fiscal 2004, the company achieved net sales of $20.2 billion compared with $19.2 billion in fiscal 2003.
Net earnings for fiscal 2004 were $280.1 million, basic earnings per share were $2.09 and diluted earnings per
share were $2.01 compared with net earnings of $257.0 million, basic earnings per share of $1.92 and diluted
earnings per share of $1.86 for fiscal 2003. Fiscal 2004 was a 53 week fiscal year, resulting in an extra week in
the fourth quarter, which generated approximately $0.4 billion in net sales and contributed approximately $.07 to
basic and diluted earnings per share. Fiscal 2004 operating results include the impact of the Asset Exchange, the
Denver Disposition and the St. Louis Strike.
Net Sales
Net sales for fiscal 2004 were $20.2 billion compared with $19.2 billion for fiscal 2003, an increase of $1.0
billion or 5.5 percent. Retail food sales were 52.2 percent of net sales for fiscal 2004 compared with 51.4 percent
for fiscal 2003. Food distribution sales were 47.8 percent of net sales for fiscal 2004 compared with 48.6 percent
in fiscal 2003.
Retail food sales for fiscal 2004 were $10.6 billion compared with $9.9 billion last year, an increase of 7.1
percent or $0.7 billion which included approximately $0.2 billion due to the benefit of the extra week. The
remainder of the increase was due to net new store and same store sales growth, which accounted for
approximately 70 percent and 30 percent of the increase, respectively. Fiscal 2004 same store retail sales, defined
as stores operating for four full quarters, including store expansions, increased 2.1 percent.
Fiscal 2004 store activity, including licensed units, resulted in 107 new stores opened and 41 stores closed,
including the sale or closure of our Denver based stores, for a total of 1,483 stores at year end. Total square
footage increased approximately 3.8 percent over the prior year.
Food distribution sales were $9.7 billion for fiscal 2004 compared to $9.3 billion in fiscal 2003, an increase
of $0.4 billion. Food distribution sales increased 3.7 percent compared with fiscal 2003, primarily reflecting the
impact of new customer affiliations and the benefit of the extra week, which accounted for approximately seven
percent and two percent, respectively and more than offset customer attrition, and the net revenue loss resulting
from of the Asset Exchange which accounted for approximately three percent and two percent, respectively.
Gross Profit
Gross profit (calculated as net sales less cost of sales), as a percent of net sales, was 14.1 percent for fiscal
2004 compared with 13.5 percent in fiscal 2003. The increase in gross profit, as a percent of net sales, primarily
reflects improved merchandising execution for retail, including the expansion of general merchandise in the
12