Albertsons 2005 Annual Report Download - page 56
Download and view the complete annual report
Please find page 56 of the 2005 Albertsons annual report below. You can navigate through the pages in the report by either clicking on the pages listed below, or by using the keyword search tool below to find specific information within the annual report.-
 1
1 -
2
-
3
-
4
-
5
-
6
-
7
-
8
-
9
-
10
-
11
-
12
-
13
-
14
-
15
-
16
-
17
-
18
-
19
-
20
-
21
-
22
-
23
-
24
-
25
-
26
-
27
-
28
-
29
-
30
-
31
-
32
-
33
-
34
-
35
-
36
-
37
-
38
-
39
-
40
-
41
-
42
-
43
-
44
-
45
-
 46
46 -
 47
47 -
 48
48 -
 49
49 -
 50
50 -
 51
51 -
 52
52 -
 53
53 -
 54
54 -
 55
55 -
 56
56 -
 57
57 -
 58
58 -
 59
59 -
 60
60 -
 61
61 -
 62
62 -
 63
63 -
 64
64 -
 65
65 -
 66
66 -
67
-
68
-
69
-
70
-
71
-
72
-
73
-
74
-
75
-
76
-
77
-
78
-
79
-
80
-
81
-
82
-
83
-
84
-
85
-
86
-
87
-
88
 |
 |

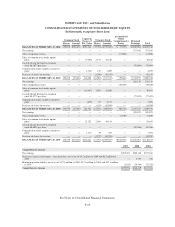
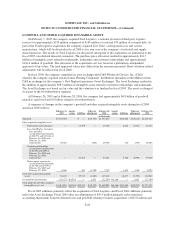
SUPERVALU INC. and Subsidiaries
CONSOLIDATED STATEMENTS OF STOCKHOLDERS’ EQUITY
(In thousands, except per share data)
Common Stock Capital in
Excess of
Par Value
Treasury Stock
Accumulated
Other
Comprehensive
Losses
Retained
Earnings TotalShares Amount Shares Amount
BALANCES AT FEBRUARY 23, 2002 150,670 $150,670 $121,444 (17,781) $(335,885) $ (7,075) $1,969,984 $1,899,138
Net earnings — — — — — — 257,042 257,042
Other comprehensive loss — — — — — (71,988) — (71,988)
Sales of common stock under option
plans — — (9,196) 2,155 47,618 — — 38,422
Cash dividends declared on common
stock $0.5675 per share — — — — — — (76,094) (76,094)
Compensation under employee incentive
plans — — 1,780 152 3,099 — — 4,879
Purchase of shares for treasury — — — (1,508) (42,159) — — (42,159)
BALANCES AT FEBRUARY 22, 2003 150,670 150,670 114,028 (16,982) (327,327) (79,063) 2,150,932 2,009,240
Net earnings — — — — — — 280,138 280,138
Other comprehensive loss — — — — — (19,669) — (19,669)
Sales of common stock under option
plans — — (11,047) 1,596 41,508 — — 30,461
Cash dividends declared on common
stock $0.5775 per share — — — — — — (77,495) (77,495)
Compensation under employee incentive
plans — — (629) 93 2,127 — — 1,498
Purchase of shares for treasury — — — (617) (14,599) — — (14,599)
BALANCES AT FEBRUARY 28, 2004 150,670 150,670 102,352 (15,910) (298,291) (98,732) 2,353,575 2,209,574
Net earnings — — — — — — 385,823 385,823
Other comprehensive loss — — — — — (5,849) — (5,849)
Sales of common stock under option
plans — — 12,522 2,646 44,143 — — 56,665
Cash dividends declared on common
stock $0.6025 per share — — — — — — (81,386) (81,386)
Compensation under employee incentive
plans — — 1,173 49 520 — — 1,693
Purchase of shares for treasury — — — (1,977) (55,959) — — (55,959)
BALANCES AT FEBRUARY 26, 2005 150,670 $150,670 $116,047 (15,192) $(309,587) $(104,581) $2,658,012 $2,510,561
2005 2004 2003
Comprehensive income:
Net earnings $385,823 $280,138 $257,042
Derivative financial instrument – unrealized loss, net of tax of $4.2 million in 2004 and $0.2 million in
2003 — 6,735 340
Minimum pension liability, net of tax of $(2.5) million in 2005, $17.1 million in 2004, and $47.1 million
in 2003 (5,849) (26,404) (72,328)
Comprehensive income $379,974 $260,469 $185,054
See Notes to Consolidated Financial Statements.
F-10