Albertsons 2005 Annual Report Download - page 17
Download and view the complete annual report
Please find page 17 of the 2005 Albertsons annual report below. You can navigate through the pages in the report by either clicking on the pages listed below, or by using the keyword search tool below to find specific information within the annual report.-
 1
1 -
2
-
3
-
4
-
5
-
6
-
 7
7 -
 8
8 -
 9
9 -
 10
10 -
 11
11 -
 12
12 -
 13
13 -
 14
14 -
 15
15 -
 16
16 -
 17
17 -
 18
18 -
 19
19 -
 20
20 -
 21
21 -
 22
22 -
 23
23 -
 24
24 -
 25
25 -
 26
26 -
 27
27 -
28
-
29
-
30
-
31
-
32
-
33
-
34
-
35
-
36
-
37
-
38
-
39
-
40
-
41
-
42
-
43
-
44
-
45
-
46
-
47
-
48
-
49
-
50
-
51
-
52
-
53
-
54
-
55
-
56
-
57
-
58
-
59
-
60
-
61
-
62
-
63
-
64
-
65
-
66
-
67
-
68
-
69
-
70
-
71
-
72
-
73
-
74
-
75
-
76
-
77
-
78
-
79
-
80
-
81
-
82
-
83
-
84
-
85
-
86
-
87
-
88
 |
 |
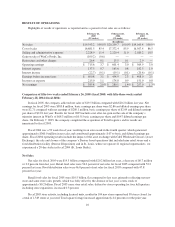
Food distribution sales for fiscal 2005 were $9.0 billion compared with $9.7 billion last year, a decrease of
$0.7 billion. Food distribution sales decreased 6.9 percent compared with last year, reflecting new business
growth of approximately 5 percent, which was more than offset by customer attrition, last year’s Asset Exchange
and the absence of the extra week in last year, which accounted for approximately seven percent, three percent
and two percent, respectively.
Gross Profit
Gross profit (calculated as net sales less cost of sales), as a percent of net sales, was 14.6 percent for fiscal
2005 compared with 14.1 percent last year. The increase in gross profit, as a percent of net sales, primarily
reflects the growing proportion of our retail food business, which operates at a higher gross profit margin as a
percentage of net sales than does the food distribution business, benefits of retail merchandising execution and
customer mix and the benefit of volume throughput including labor productivity improvements in distribution.
Selling and Administrative Expenses
Selling and administrative expenses, as a percentage of net sales, were 11.4 percent for fiscal 2005
compared with 11.0 percent last year. The increase in selling and administrative expenses, as a percent of net
sales, primarily reflects the growing proportion of the company’s retail food business, which operates at a higher
selling and administrative expense as a percent of net sales than does the food distribution business.
Restructure and Other Charges
In fiscal 2005, the company incurred $26.4 million, or 0.1 percent of net sales, in pre-tax restructure and
other charges, consisting of $18.0 million for increased liabilities associated with employee benefit related costs
from previously exited food distribution facilities and $8.4 million for changes in estimates on exited real estate.
In fiscal 2004, the company incurred $15.5 million, or 0.1 percent of net sales in pre-tax restructure and other
charges, consisting of $7.0 million for changes in estimates on exited real estate for food distribution and $8.5
million for increased liabilities associated with employee benefit related costs from previously exited food
distribution facilities.
Operating Earnings
Operating earnings for fiscal 2005 increased 19.0 percent to $715.6 million compared with $601.4 million
last year, primarily reflecting the fiscal 2005 $109.2 million pre-tax gain on the sale of WinCo. Fiscal 2005
operating earnings include $26.4 million in pre-tax restructure and other charges. Fiscal 2004 operating earnings
include $15.5 million in pre-tax restructure and other charges. Retail food operating earnings for fiscal 2005
increased 0.5 percent to $446.3 million, or 4.2 percent of net sales, from last year’s operating earnings of $444.0
million, or 4.2 percent of net sales. The increase in retail food operating earnings primarily reflects the benefits of
retail merchandising execution, which offset the absence of last year’s extra week and WinCo earnings. Food
distribution operating earnings for fiscal 2005 increased 5.4 percent to $234.6 million, or 2.6 percent of net sales,
from last year’s operating earnings of $222.5 million, or 2.3 percent of net sales. The increase in food distribution
operating earnings primarily reflects customer mix and the benefit of volume throughput including labor
productivity improvements, which more than offset the absence of last year’s extra week.
Net Interest Expense
Net interest expense was $114.8 million in fiscal 2005 compared with $146.5 million last year. The decrease
primarily reflects lower borrowing levels.
Income Taxes
The overall effective tax rate was 35.8 percent and 38.4 percent in fiscal 2005 and fiscal 2004, respectively.
Last year’s effective tax rate reflects $7.6 million of taxes related to the Asset Exchange. In both fiscal 2005 and
fiscal 2004, the effective tax rate reflects the impact of net favorable tax settlements occurring in each year.
11