XM Radio 2008 Annual Report Download - page 54
Download and view the complete annual report
Please find page 54 of the 2008 XM Radio annual report below. You can navigate through the pages in the report by either clicking on the pages listed below, or by using the keyword search tool below to find specific information within the annual report.-
 1
1 -
2
-
3
-
4
-
5
-
6
-
7
-
8
-
9
-
10
-
11
-
12
-
13
-
14
-
15
-
16
-
17
-
18
-
19
-
20
-
21
-
22
-
23
-
24
-
25
-
26
-
27
-
28
-
29
-
30
-
31
-
32
-
33
-
34
-
35
-
36
-
37
-
38
-
39
-
40
-
41
-
42
-
43
-
 44
44 -
 45
45 -
 46
46 -
 47
47 -
 48
48 -
 49
49 -
 50
50 -
 51
51 -
 52
52 -
 53
53 -
 54
54 -
 55
55 -
 56
56 -
 57
57 -
 58
58 -
 59
59 -
 60
60 -
 61
61 -
 62
62 -
 63
63 -
 64
64 -
65
-
66
-
67
-
68
-
69
-
70
-
71
-
72
-
73
-
74
-
75
-
76
-
77
-
78
-
79
-
80
-
81
-
82
-
83
-
84
-
85
-
86
-
87
-
88
-
89
-
90
-
91
-
92
-
93
-
94
-
95
-
96
-
97
-
98
-
99
-
100
-
101
-
102
-
103
-
104
-
105
-
106
-
107
-
108
-
109
-
110
-
111
-
112
-
113
-
114
-
115
-
116
-
117
-
118
-
119
-
120
-
121
-
122
-
123
-
124
-
125
-
126
-
127
-
128
-
129
-
130
-
131
-
132
-
133
-
134
-
135
-
136
-
137
-
138
-
139
-
140
-
141
-
142
-
143
-
144
-
145
-
146
-
147
-
148
-
149
-
150
-
151
-
152
-
153
-
154
-
155
-
156
-
157
-
158
-
159
-
160
-
161
-
162
-
163
-
164
-
165
-
166
-
167
-
168
-
169
-
170
-
171
-
172
-
173
-
174
-
175
-
176
-
177
-
178
-
179
-
180
-
181
-
182
-
183
-
184
-
185
-
186
-
187
-
188
 |
 |

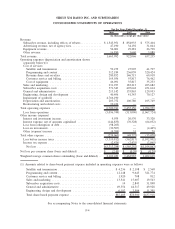
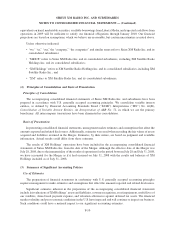
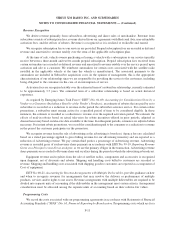
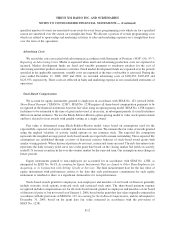
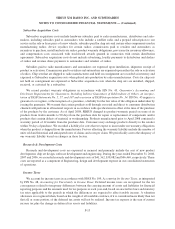
SIRIUS XM RADIO INC. AND SUBSIDIARIES
CONSOLIDATED STATEMENTS OF OPERATIONS
2008 2007 2006
For the Years Ended December 31,
(In thousands, except per share data)
Revenue:
Subscriber revenue, including effects of rebates ............. $1,543,951 $ 854,933 $ 575,404
Advertising revenue, net of agency fees................... 47,190 34,192 31,044
Equipment revenue .................................. 56,001 29,281 26,798
Other revenue...................................... 16,850 3,660 3,989
Total revenue ........................................ 1,663,992 922,066 637,235
Operating expenses (depreciation and amortization shown
separately below)(1)
Cost of services:
Satellite and transmission . . . ........................ 59,279 27,907 41,797
Programming and content . . . ........................ 312,189 236,059 520,424
Revenue share and royalties . ........................ 280,852 146,715 69,918
Customer service and billing . ........................ 165,036 93,817 76,462
Cost of equipment ................................ 46,091 35,817 35,233
Sales and marketing ................................. 231,937 183,213 203,682
Subscriber acquisition costs . . . ........................ 371,343 407,642 451,614
General and administrative ............................ 213,142 155,863 129,953
Engineering, design and development .................... 40,496 41,343 70,127
Impairment of goodwill .............................. 4,766,190 — —
Depreciation and amortization. . ........................ 203,752 106,780 105,749
Restructuring and related costs . ........................ 10,434 — —
Total operating expenses ............................... 6,700,741 1,435,156 1,704,959
Loss from operations ................................ (5,036,749) (513,090) (1,067,724)
Other income (expense)
Interest and investment income . ........................ 9,079 20,570 33,320
Interest expense, net of amounts capitalized ............... (144,833) (70,328) (64,032)
Loss from redemption of debt . . ........................ (98,203) — —
Loss on investments ................................. (30,507) — (4,445)
Other (expense) income .............................. (9,599) 31 79
Total other expense ................................... (274,063) (49,727) (35,078)
Loss before income taxes ............................. (5,310,812) (562,817) (1,102,802)
Income tax expense ................................. (2,476) (2,435) (2,065)
Net loss ........................................ $(5,313,288) $ (565,252) $(1,104,867)
Net loss per common share (basic and diluted) ............... $ (2.45) $ (0.39) $ (0.79)
Weighted average common shares outstanding (basic and diluted) . . 2,169,489 1,462,967 1,402,619
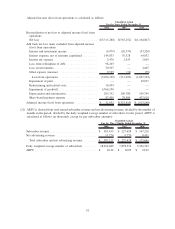
(1) Amounts related to share-based payment expense included in operating expenses were as follows:
Satellite and transmission .................................. $ 4,236 $ 2,198 $ 2,568
Programming and content .................................. 12,148 9,643 321,774
Customer service and billing ................................ 1,920 708 812
Sales and marketing ...................................... 13,541 15,607 19,543
Subscriber acquisition costs ................................. 14 2,843 31,898
General and administrative ................................. 49,354 44,317 49,928
Engineering, design and development ......................... 6,192 3,584 11,395
Total share-based payment expense ........................... $87,405 $78,900 $437,918
See accompanying Notes to the consolidated financial statements.
F-4