XM Radio 2008 Annual Report Download - page 10
Download and view the complete annual report
Please find page 10 of the 2008 XM Radio annual report below. You can navigate through the pages in the report by either clicking on the pages listed below, or by using the keyword search tool below to find specific information within the annual report.-
 1
1 -
 2
2 -
 3
3 -
 4
4 -
 5
5 -
 6
6 -
 7
7 -
 8
8 -
 9
9 -
 10
10 -
 11
11 -
 12
12 -
 13
13 -
 14
14 -
 15
15 -
 16
16 -
 17
17 -
 18
18 -
 19
19 -
 20
20 -
 21
21 -
22
-
23
-
24
-
25
-
26
-
27
-
28
-
29
-
30
-
31
-
32
-
33
-
34
-
35
-
36
-
37
-
38
-
39
-
40
-
41
-
42
-
43
-
44
-
45
-
46
-
47
-
48
-
49
-
50
-
51
-
52
-
53
-
54
-
55
-
56
-
57
-
58
-
59
-
60
-
61
-
62
-
63
-
64
-
65
-
66
-
67
-
68
-
69
-
70
-
71
-
72
-
73
-
74
-
75
-
76
-
77
-
78
-
79
-
80
-
81
-
82
-
83
-
84
-
85
-
86
-
87
-
88
-
89
-
90
-
91
-
92
-
93
-
94
-
95
-
96
-
97
-
98
-
99
-
100
-
101
-
102
-
103
-
104
-
105
-
106
-
107
-
108
-
109
-
110
-
111
-
112
-
113
-
114
-
115
-
116
-
117
-
118
-
119
-
120
-
121
-
122
-
123
-
124
-
125
-
126
-
127
-
128
-
129
-
130
-
131
-
132
-
133
-
134
-
135
-
136
-
137
-
138
-
139
-
140
-
141
-
142
-
143
-
144
-
145
-
146
-
147
-
148
-
149
-
150
-
151
-
152
-
153
-
154
-
155
-
156
-
157
-
158
-
159
-
160
-
161
-
162
-
163
-
164
-
165
-
166
-
167
-
168
-
169
-
170
-
171
-
172
-
173
-
174
-
175
-
176
-
177
-
178
-
179
-
180
-
181
-
182
-
183
-
184
-
185
-
186
-
187
-
188
 |
 |

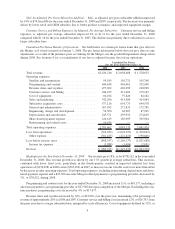
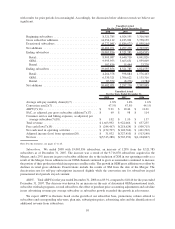
Subscribers. We ended the fourth quarter 2008 with 19,003,856 subscribers, an increase of 10% from the
17,348,622 subscribers as of December 31, 2007. Gross subscriber additions decreased about 27% in the fourth
quarter of 2008 from the fourth quarter of 2007. Gross additions in our OEM channel were approximately 13%
lower in the fourth quarter versus the prior year period, with higher production penetration failing to offset declines
in auto sales. Auto sales fell 35% in the fourth quarter of 2008 to 2.5 million from 3.8 million in the fourth quarter of
2007. The decline in OEM gross additions was also accompanied by declines in retail gross additions. Deactivations
for self-pay subscriptions remained relatively consistent at 1.8% per month; deactivations due to non-conversions of
subscribers in paid promotional trial periods increased as production penetration rates increased.
ARPU. Total ARPU for the three months ended December 31, 2008 was $10.60, compared to $10.42 for the
three months ended December 31, 2007. The increase was driven by the start of our “Best of” package sales, most of
which were at the $16.99 price point, and by lower OEM inventories. These factors were partially offset by an
increase in the mix of discounted OEM promotional trials, subscriber winback programs, second subscribers and a
decline in net advertising revenue per average subscriber.
SAC, As Adjusted, Per Gross Subscriber Addition. SAC, as adjusted, per gross subscriber addition was $70
and $83 for the three months ended December 31, 2008 and 2007, respectively. The decrease was primarily driven
by lower retail and OEM subsidies due to better product economics and improved equipment margin.
Customer Service and Billing Expenses, As Adjusted, Per Average Subscriber. Customer service and billing
expenses, as adjusted, per average subscriber declined 9% to $1.18 for the three months ended December 31, 2008
compared with $1.30 for the three months ended December 31, 2007. The decline was primarily due to efficiencies
across a larger subscriber base.
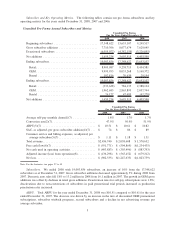
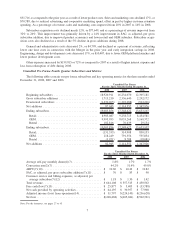
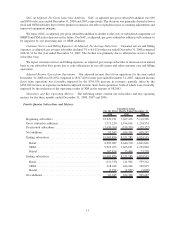
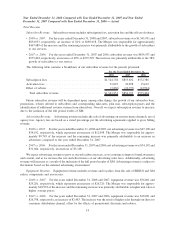
Unaudited Pro Forma Results of Operations. Set forth below are certain pro forma items that give effect to
the Merger as if it had occurred on January 1, 2006. The pro forma information below does not give effect to any
adjustments as a result the purchase price accounting for the Merger, nor the goodwill impairment charge taken
during 2008. See footnote 14 for a reconciliation of net loss to adjusted income (loss) from operations.
2008 2007 2006
Unaudited Pro Forma
For the Three Months Ended December 31,
Total revenue .................................... $644,108 $ 557,515 $ 450,502
Operating expenses:
Satellite and transmission ......................... 22,851 23,697 23,609
Programming and content ......................... 105,215 109,076 97,990
Revenue share and royalties ....................... 122,711 163,541 64,467
Customer service and billing ....................... 67,036 65,006 53,980
Cost of equipment............................... 18,084 37,334 42,630
Sales and marketing ............................. 81,712 123,711 146,650
Subscriber acquisition costs ........................ 132,731 180,767 189,868
General and administrative ........................ 51,591 64,223 49,326
Engineering, design and development ................ 10,380 14,303 18,610
Depreciation and amortization ...................... 49,519 75,045 71,538
Share-based payment expense ...................... 24,945 52,897 68,649
Restructuring and related costs ..................... 2,977 — —
Total operating expenses ............................ 689,752 909,600 827,317
Loss from operations .............................. (45,644) (352,085) (376,815)
Other expense .................................. (202,649) (52,055) (124,113)
Loss before income taxes ........................... (248,293) (404,140) (500,928)
Income tax expense.............................. (175) (901) (1,393)
Net loss . ....................................... $(248,468) $(405,041) $(502,321)
8