XM Radio 2008 Annual Report Download - page 45
Download and view the complete annual report
Please find page 45 of the 2008 XM Radio annual report below. You can navigate through the pages in the report by either clicking on the pages listed below, or by using the keyword search tool below to find specific information within the annual report.-
 1
1 -
2
-
3
-
4
-
5
-
6
-
7
-
8
-
9
-
10
-
11
-
12
-
13
-
14
-
15
-
16
-
17
-
18
-
19
-
20
-
21
-
22
-
23
-
24
-
25
-
26
-
27
-
28
-
29
-
30
-
31
-
32
-
33
-
34
-
 35
35 -
 36
36 -
 37
37 -
 38
38 -
 39
39 -
 40
40 -
 41
41 -
 42
42 -
 43
43 -
 44
44 -
 45
45 -
 46
46 -
 47
47 -
 48
48 -
 49
49 -
 50
50 -
 51
51 -
 52
52 -
 53
53 -
 54
54 -
 55
55 -
56
-
57
-
58
-
59
-
60
-
61
-
62
-
63
-
64
-
65
-
66
-
67
-
68
-
69
-
70
-
71
-
72
-
73
-
74
-
75
-
76
-
77
-
78
-
79
-
80
-
81
-
82
-
83
-
84
-
85
-
86
-
87
-
88
-
89
-
90
-
91
-
92
-
93
-
94
-
95
-
96
-
97
-
98
-
99
-
100
-
101
-
102
-
103
-
104
-
105
-
106
-
107
-
108
-
109
-
110
-
111
-
112
-
113
-
114
-
115
-
116
-
117
-
118
-
119
-
120
-
121
-
122
-
123
-
124
-
125
-
126
-
127
-
128
-
129
-
130
-
131
-
132
-
133
-
134
-
135
-
136
-
137
-
138
-
139
-
140
-
141
-
142
-
143
-
144
-
145
-
146
-
147
-
148
-
149
-
150
-
151
-
152
-
153
-
154
-
155
-
156
-
157
-
158
-
159
-
160
-
161
-
162
-
163
-
164
-
165
-
166
-
167
-
168
-
169
-
170
-
171
-
172
-
173
-
174
-
175
-
176
-
177
-
178
-
179
-
180
-
181
-
182
-
183
-
184
-
185
-
186
-
187
-
188
 |
 |

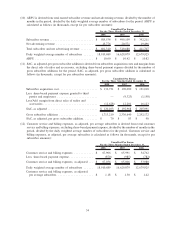
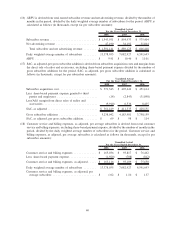
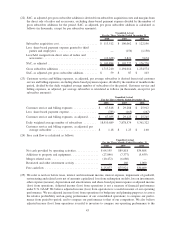
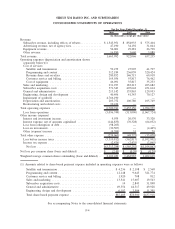
(22) SAC, as adjusted, per gross subscriber addition is derived from subscriber acquisition costs and margins from
the direct sale of radios and accessories, excluding share-based payment expense divided by the number of
gross subscriber additions for the period. SAC, as adjusted, per gross subscriber addition is calculated as
follows (in thousands, except for per subscriber amounts):
2008 2007 2006
Unaudited Actual
For the Three Months Ended December 31,
Subscriber acquisition cost ........................ $ 113,512 $ 100,062 $ 122,196
Less: share-based payment expense granted to third
parties and employees ......................... — (156) (1,150)
Less/Add: margin from direct sales of radios and
accessories .................................. (12,628) 3,821 5,674
SAC, as adjusted ............................... $ 100,884 $ 103,727 $ 126,720
Gross subscriber additions ........................ 1,713,210 1,194,014 1,234,574
SAC, as adjusted, per gross subscriber addition ......... $ 59 $ 87 $ 103
(23) Customer service and billing expenses, as adjusted, per average subscriber is derived from total customer
service and billing expenses, excluding share-based payment expense, divided by the number of months in the
period, divided by the daily weighted average number of subscribers for the period. Customer service and
billing expenses, as adjusted, per average subscriber is calculated as follows (in thousands, except for per
subscriber amounts):
2008 2007 2006
Unaudited Actual
For the Three Months Ended December 31,
Customer service and billing expenses .............. $ 67,818 $ 29,288 $ 25,912
Less: share-based payment expense................. (783) (165) (167)
Customer service and billing expenses, as adjusted . .... $ 67,035 $ 29,123 $ 25,745
Daily weighted average number of subscribers ........ 18,910,689 7,878,574 5,361,322
Customer service and billing expenses, as adjusted, per
average subscriber ........................... $ 1.18 $ 1.23 $ 1.60
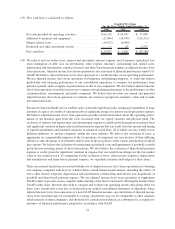
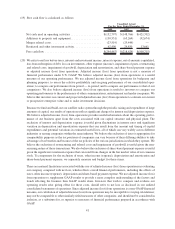
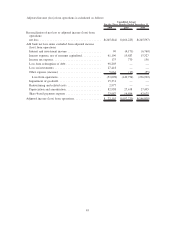
(24) Free cash flow is calculated as follows:
2008 2007 2006
Unaudited Actual
For the Three Months Ended December 31,
Net cash provided by operating activities .............. $64,195 $89,818 $34,868
Additions to property and equipment ................. (27,846) (7,377) (5,459)
Merger related costs ............................. (10,472) (6,680) —
Restricted and other investment activity ............... — 160 1,000
Free cash flow ................................. $25,877 $75,921 $30,409
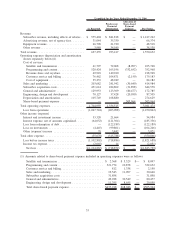
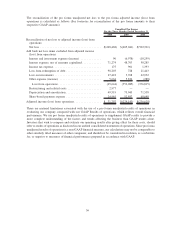
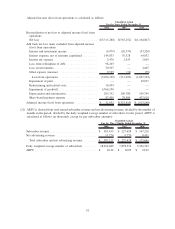
(25) We refer to net loss before taxes, interest and investment income, interest expense, impairment of goodwill,
restructuring and related costs net of amounts capitalized, loss from redemption on debt, loss on investments,
other expense (income), depreciation and amortization, and share-based payment expense as adjusted income
(loss) from operations. Adjusted income (loss) from operations is not a measure of financial performance
under U.S. GAAP. We believe adjusted income (loss) from operations is a useful measure of our operating
performance. We use adjusted income (loss) from operations for budgetary and planning purposes; to assess
the relative profitability and on-going performance of our consolidated operations; to compare our perfor-
mance from period-to-period; and to compare our performance to that of our competitors. We also believe
adjusted income (loss) from operations is useful to investors to compare our operating performance to the
43