XM Radio 2008 Annual Report Download - page 135
Download and view the complete annual report
Please find page 135 of the 2008 XM Radio annual report below. You can navigate through the pages in the report by either clicking on the pages listed below, or by using the keyword search tool below to find specific information within the annual report.-
 1
1 -
2
-
3
-
4
-
5
-
6
-
7
-
8
-
9
-
10
-
11
-
12
-
13
-
14
-
15
-
16
-
17
-
18
-
19
-
20
-
21
-
22
-
23
-
24
-
25
-
26
-
27
-
28
-
29
-
30
-
31
-
32
-
33
-
34
-
35
-
36
-
37
-
38
-
39
-
40
-
41
-
42
-
43
-
44
-
45
-
46
-
47
-
48
-
49
-
50
-
51
-
52
-
53
-
54
-
55
-
56
-
57
-
58
-
59
-
60
-
61
-
62
-
63
-
64
-
65
-
66
-
67
-
68
-
69
-
70
-
71
-
72
-
73
-
74
-
75
-
76
-
77
-
78
-
79
-
80
-
81
-
82
-
83
-
84
-
85
-
86
-
87
-
88
-
89
-
90
-
91
-
92
-
93
-
94
-
95
-
96
-
97
-
98
-
99
-
100
-
101
-
102
-
103
-
104
-
105
-
106
-
107
-
108
-
109
-
110
-
111
-
112
-
113
-
114
-
115
-
116
-
117
-
118
-
119
-
120
-
121
-
122
-
123
-
124
-
 125
125 -
 126
126 -
 127
127 -
 128
128 -
 129
129 -
 130
130 -
 131
131 -
 132
132 -
 133
133 -
 134
134 -
 135
135 -
 136
136 -
 137
137 -
 138
138 -
 139
139 -
 140
140 -
 141
141 -
 142
142 -
 143
143 -
 144
144 -
 145
145 -
146
-
147
-
148
-
149
-
150
-
151
-
152
-
153
-
154
-
155
-
156
-
157
-
158
-
159
-
160
-
161
-
162
-
163
-
164
-
165
-
166
-
167
-
168
-
169
-
170
-
171
-
172
-
173
-
174
-
175
-
176
-
177
-
178
-
179
-
180
-
181
-
182
-
183
-
184
-
185
-
186
-
187
-
188
 |
 |

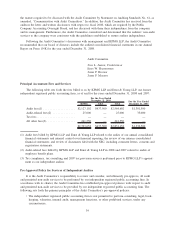
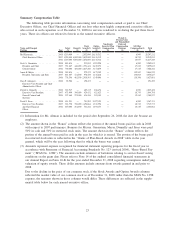
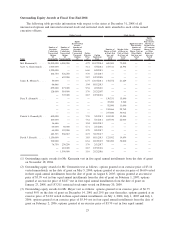
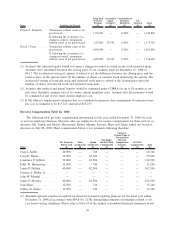
Summary Compensation Table
The following table provides information concerning total compensation earned or paid to our Chief
Executive Officer, our Chief Financial Officer and our four other most highly compensated executive officers
who served in such capacities as of December 31, 2008 for services rendered to us during the past three fiscal
years. These six officers are referred to herein as the named executive officers.
Name and Principal
Position Year
Salary
($)
Bonus(2)
($)
Stock
Awards(3)
($)
Option
Awards(3)
($)
Non-Equity
Incentive Plan
Compensation
($)
Change in
Pension Value
and Nonqualified
Deferred
Compensation
Earnings
($)
All Other
Compensation(4)
($)
Total
($)
Mel Karmazin ................. 2008 1,250,000 — 2,832,000 24,118,312 — — 6,900 28,207,212
Chief Executive Officer 2007 1,250,000 4,000,000 2,832,000 24,118,312 — — 18,743 32,219,055
2006 1,250,000 3,000,000 2,832,000 24,118,312 — — 16,937 31,217,249
Scott A. Greenstein . ............. 2008 845,834 — 233,853 1,903,228 — — 6,900 2,989,815
President and Chief 2007 791,667 440,000 1,351,441 2,439,272 — — 17,243 5,039,623
Content Officer 2006 700,000 400,000 2,817,260 3,153,839 — — 17,145 7,088,244
James E. Meyer . . . ............. 2008 945,834 — 272,125 1,473,309 — — 152,967 2,844,235
President, Operations and Sales 2007 891,667 512,500 978,439 1,132,218 — — 136,003 3,650,827
2006 778,396 462,500 2,918,503 1,349,806 — — 118,396 5,627,601
Dara F. Altman(1) . . ............. 2008 92,986 — 198,473 — — — — 291,459
Executive Vice President and Chief
Administrative Officer
Patrick L. Donnelly . ............. 2008 522,917 — 405,135 888,476 — — 6,900 1,823,428
Executive Vice President, 2007 475,000 300,000 429,432 621,623 — — 18,743 1,844,798
General Counsel and 2006 397,464 225,000 434,196 305,105 — — 19,162 1,380,927
Secretary
David J. Frear ................. 2008 631,251 — 701,985 2,027,195 — — 6,900 3,367,331
Executive Vice President 2007 518,750 350,000 1,496,884 1,331,396 — — 18,743 3,715,773
and Chief Financial 2006 450,000 262,500 341,244 1,394,133 — — 16,185 2,464,062
Officer
(1) Information for Ms. Altman is included for the period after September 26, 2008, the date she became an
employee.
(2) The amount shown in the “Bonus” column reflects the portion of the annual bonus paid in cash in 2008
with respect to 2007 performance. Bonuses for Messrs. Greenstein, Meyer, Donnelly and Frear were paid
50% in cash and 50% in restricted stock units. The amount shown in the “Bonus” column reflects the
portion of the annual bonus paid in cash in the year for which it is earned. The portion of the bonus paid
in restricted stock units is reflected in the “Grants of Plan-Based Awards in 2008” table in the year
granted, which will be the year following that for which the bonus was earned.
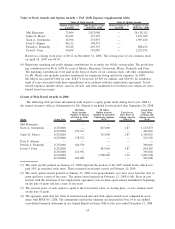
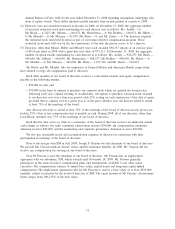
(3) Amounts represent expense recognized for financial statement reporting purposes for the fiscal year in
accordance with Statement of Financial Accounting Standards No. 123 (revised 2004), “Share-Based Pay-
ment” (“SFAS No. 123R”). The amounts exclude estimates of forfeitures relating to service-based vesting
conditions on the grant date. Please refer to Note 14 of the audited consolidated financial statements in
our Annual Report on Form 10-K for the year ended December 31, 2008 regarding assumptions underlying
valuation of equity awards. These dollar amounts include amounts from awards granted in and prior to
2008.
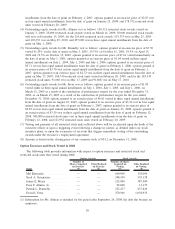
Due to the decline in the price of our common stock, if the Stock Awards and Option Awards columns
reflected the market value of our common stock as of December 31, 2008 rather than the SFAS No. 123R
expense, the amounts shown in those columns would differ. These differences are reflected in the supple-
mental table below for each named executive officer.
23