XM Radio 2008 Annual Report Download - page 21
Download and view the complete annual report
Please find page 21 of the 2008 XM Radio annual report below. You can navigate through the pages in the report by either clicking on the pages listed below, or by using the keyword search tool below to find specific information within the annual report.-
 1
1 -
2
-
3
-
4
-
5
-
6
-
7
-
8
-
9
-
10
-
 11
11 -
 12
12 -
 13
13 -
 14
14 -
 15
15 -
 16
16 -
 17
17 -
 18
18 -
 19
19 -
 20
20 -
 21
21 -
 22
22 -
 23
23 -
 24
24 -
 25
25 -
 26
26 -
 27
27 -
 28
28 -
 29
29 -
 30
30 -
 31
31 -
32
-
33
-
34
-
35
-
36
-
37
-
38
-
39
-
40
-
41
-
42
-
43
-
44
-
45
-
46
-
47
-
48
-
49
-
50
-
51
-
52
-
53
-
54
-
55
-
56
-
57
-
58
-
59
-
60
-
61
-
62
-
63
-
64
-
65
-
66
-
67
-
68
-
69
-
70
-
71
-
72
-
73
-
74
-
75
-
76
-
77
-
78
-
79
-
80
-
81
-
82
-
83
-
84
-
85
-
86
-
87
-
88
-
89
-
90
-
91
-
92
-
93
-
94
-
95
-
96
-
97
-
98
-
99
-
100
-
101
-
102
-
103
-
104
-
105
-
106
-
107
-
108
-
109
-
110
-
111
-
112
-
113
-
114
-
115
-
116
-
117
-
118
-
119
-
120
-
121
-
122
-
123
-
124
-
125
-
126
-
127
-
128
-
129
-
130
-
131
-
132
-
133
-
134
-
135
-
136
-
137
-
138
-
139
-
140
-
141
-
142
-
143
-
144
-
145
-
146
-
147
-
148
-
149
-
150
-
151
-
152
-
153
-
154
-
155
-
156
-
157
-
158
-
159
-
160
-
161
-
162
-
163
-
164
-
165
-
166
-
167
-
168
-
169
-
170
-
171
-
172
-
173
-
174
-
175
-
176
-
177
-
178
-
179
-
180
-
181
-
182
-
183
-
184
-
185
-
186
-
187
-
188
 |
 |

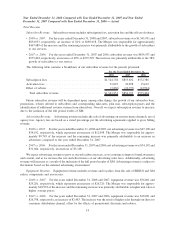
Loss from redemption of debt. Loss from redemption of debt includes losses incurred as a result of the
conversion of our 21⁄2% Convertible Notes due 2009.
•2008 vs. 2007: For the year ended December 31, 2008 and 2007, loss from redemption of debt was $98,203
and $0, respectively.
•2007 vs. 2006: For the years ended December 31, 2007 and 2006, we did not incur any losses from the
redemption of our debt.
Loss on investments. Loss on investments includes our share of SIRIUS Canada’s and XM Canada’s net
losses, and losses recorded from our investment in XM Canada when the fair value was determined to be other than
temporary.
•2008 vs. 2007: For the year ended December 31, 2008, loss on investment was $30,507 and $0,
respectively.
•2007 vs. 2006: For the years ended December 31, 2006, loss on investment was $0 and $4,445,
respectively.
Income Taxes
Income Tax Expense. Income tax expense represents the recognition of a deferred tax liability related to the
difference in accounting for our FCC licenses, which is amortized over 15 years for tax purposes but not amortized
for book purposes in accordance with U.S. generally accepted accounting principles.
•2008 vs. 2007: We recorded income tax expense of $2,476 and $2,435 for the years ended December 31,
2008 and 2007, respectively.
•2007 vs. 2006: We recorded income tax expense of $2,435 and $2,065 for the years ended December 31,
2007 and 2006, respectively.
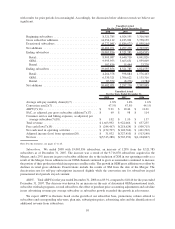
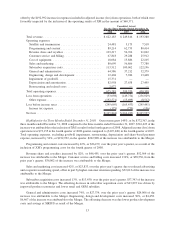
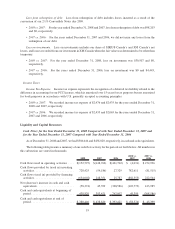
Liquidity and Capital Resources
Cash Flows for the Year Ended December 31, 2008 Compared with Year Ended December 31, 2007 and
for the Year Ended December 31, 2007 Compared with Year Ended December 31, 2006
As of December 31, 2008 and 2007, we had $380,446 and $438,820, respectively, in cash and cash equivalents.
The following table presents a summary of our cash flow activity for the periods set forth below. All numbers in
this subsection are stated in thousands:
2008 2007 2006
2008 vs.
2007
2007 vs.
2006
Cash flows used in operating activities .... $(152,797) $(148,766) $(421,702) $ (4,031) $ 272,936
Cash flows provided by (used in) investing
activities ......................... 728,425 (54,186) 27,329 782,611 (81,515)
Cash flows (used in) provided by financing
activities ......................... (634,002) 248,351 25,787 (882,353) 222,564
Net (decrease) increase in cash and cash
equivalents ....................... (58,374) 45,399 (368,586) (103,773) 413,985
Cash and cash equivalents at beginning of
period........................... 438,820 393,421 762,007 45,399 (368,586)
Cash and cash equivalents at end of
period........................... $380,446 $ 438,820 $ 393,421 $ (58,374) $ 45,399
19