XM Radio 2008 Annual Report Download - page 34
Download and view the complete annual report
Please find page 34 of the 2008 XM Radio annual report below. You can navigate through the pages in the report by either clicking on the pages listed below, or by using the keyword search tool below to find specific information within the annual report.-
 1
1 -
2
-
3
-
4
-
5
-
6
-
7
-
8
-
9
-
10
-
11
-
12
-
13
-
14
-
15
-
16
-
17
-
18
-
19
-
20
-
21
-
22
-
23
-
 24
24 -
 25
25 -
 26
26 -
 27
27 -
 28
28 -
 29
29 -
 30
30 -
 31
31 -
 32
32 -
 33
33 -
 34
34 -
 35
35 -
 36
36 -
 37
37 -
 38
38 -
 39
39 -
 40
40 -
 41
41 -
 42
42 -
 43
43 -
 44
44 -
45
-
46
-
47
-
48
-
49
-
50
-
51
-
52
-
53
-
54
-
55
-
56
-
57
-
58
-
59
-
60
-
61
-
62
-
63
-
64
-
65
-
66
-
67
-
68
-
69
-
70
-
71
-
72
-
73
-
74
-
75
-
76
-
77
-
78
-
79
-
80
-
81
-
82
-
83
-
84
-
85
-
86
-
87
-
88
-
89
-
90
-
91
-
92
-
93
-
94
-
95
-
96
-
97
-
98
-
99
-
100
-
101
-
102
-
103
-
104
-
105
-
106
-
107
-
108
-
109
-
110
-
111
-
112
-
113
-
114
-
115
-
116
-
117
-
118
-
119
-
120
-
121
-
122
-
123
-
124
-
125
-
126
-
127
-
128
-
129
-
130
-
131
-
132
-
133
-
134
-
135
-
136
-
137
-
138
-
139
-
140
-
141
-
142
-
143
-
144
-
145
-
146
-
147
-
148
-
149
-
150
-
151
-
152
-
153
-
154
-
155
-
156
-
157
-
158
-
159
-
160
-
161
-
162
-
163
-
164
-
165
-
166
-
167
-
168
-
169
-
170
-
171
-
172
-
173
-
174
-
175
-
176
-
177
-
178
-
179
-
180
-
181
-
182
-
183
-
184
-
185
-
186
-
187
-
188
 |
 |

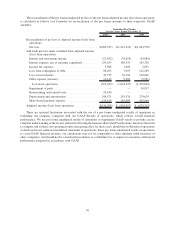
As
Reported
Predecessor
Financial
Information
Allocation of
Share-based
Payment
Expense Pro Forma
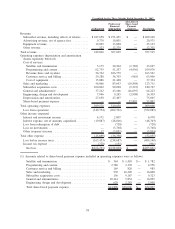
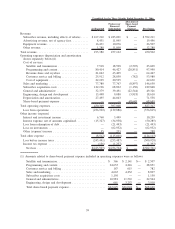
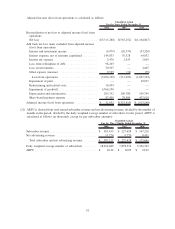
Unaudited for the Years Ended December 31, 2007
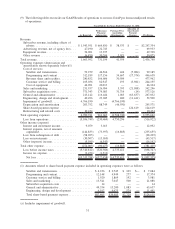
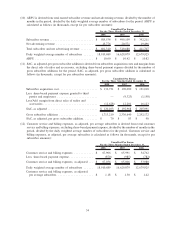
Revenue:
Subscriber revenue, including effects of rebates. . . $ 854,933 $1,024,833 $ — $ 1,879,766
Advertising revenue, net of agency fees ........ 34,192 39,148 — 73,340
Equipment revenue........................ 29,281 28,333 — 57,614
Other revenue ........................... 3,660 44,228 — 47,888
Total revenue. ............................. 922,066 1,136,542 — 2,058,608
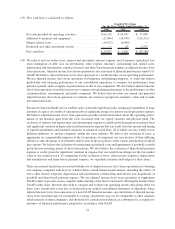
Operating expenses (depreciation and amortization
shown separately below)(1)
Cost of services:
Satellite and transmission ................. 27,907 81,036 (7,222) 101,721
Programming and content ................. 236,059 183,900 (18,498) 401,461
Revenue share and royalties ............... 146,715 256,344 — 403,059
Customer service and billing ............... 93,817 126,776 (3,191) 217,402
Cost of equipment ...................... 35,817 62,003 — 97,820
Sales and marketing ....................... 183,213 269,930 (40,059) 413,084
Subscriber acquisition costs ................. 407,642 259,143 (12,010) 654,775
General and administrative .................. 155,863 188,574 (72,606) 271,831
Engineering, design and development .......... 41,343 33,077 (11,513) 62,907
Depreciation and amortization ............... 106,780 187,196 — 293,976
Share-based payment expense................ — — 165,099 165,099
Total operating expenses ..................... 1,435,156 1,647,979 — 3,083,135
Loss from operations ...................... (513,090) (511,437) — (1,024,527)
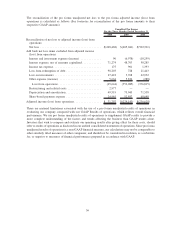
Other income (expense)
Interest and investment income ............... 20,570 14,084 — 34,654
Interest expense, net of amounts capitalized ..... (70,328) (116,605) — (186,933)
Loss from redemption of debt................ — (3,693) — (3,693)
Loss on investments ....................... — (56,156) — (56,156)
Other (expense) income .................... 31 (9,513) — (9,482)
Total other expense ......................... (49,727) (171,883) — (221,610)
Loss before income taxes ................... (562,817) (683,320) — (1,246,137)
Income tax expense ....................... (2,435) 939 — (1,496)
Net loss . ............................. $ (565,252) $ (682,381) $ — $(1,247,633)
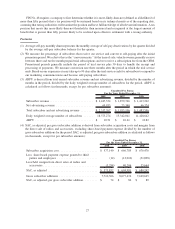
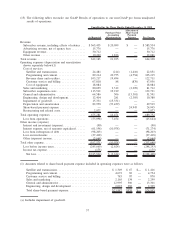
(1) Amounts related to share-based payment expense included in operating expenses were as follows:
Satellite and transmission ............................. $ 2,198 $ 5,024 $— $ 7,222
Programming and content ............................. 9,643 8,855 — 18,498
Customer service and billing .......................... 708 2,483 — 3,191
Sales and marketing ................................. 15,607 24,452 — 40,059
Subscriber acquisition costs ........................... 2,843 9,167 — 12,010
General and administrative ............................ 44,317 28,289 — 72,606
Engineering, design and development .................... 3,584 7,929 — 11,513
Total share-based payment expense ...................... $78,900 $86,199 $— $165,099
32