XM Radio 2008 Annual Report Download - page 49
Download and view the complete annual report
Please find page 49 of the 2008 XM Radio annual report below. You can navigate through the pages in the report by either clicking on the pages listed below, or by using the keyword search tool below to find specific information within the annual report.-
 1
1 -
2
-
3
-
4
-
5
-
6
-
7
-
8
-
9
-
10
-
11
-
12
-
13
-
14
-
15
-
16
-
17
-
18
-
19
-
20
-
21
-
22
-
23
-
24
-
25
-
26
-
27
-
28
-
29
-
30
-
31
-
32
-
33
-
34
-
35
-
36
-
37
-
38
-
 39
39 -
 40
40 -
 41
41 -
 42
42 -
 43
43 -
 44
44 -
 45
45 -
 46
46 -
 47
47 -
 48
48 -
 49
49 -
 50
50 -
 51
51 -
 52
52 -
 53
53 -
 54
54 -
 55
55 -
 56
56 -
 57
57 -
 58
58 -
 59
59 -
60
-
61
-
62
-
63
-
64
-
65
-
66
-
67
-
68
-
69
-
70
-
71
-
72
-
73
-
74
-
75
-
76
-
77
-
78
-
79
-
80
-
81
-
82
-
83
-
84
-
85
-
86
-
87
-
88
-
89
-
90
-
91
-
92
-
93
-
94
-
95
-
96
-
97
-
98
-
99
-
100
-
101
-
102
-
103
-
104
-
105
-
106
-
107
-
108
-
109
-
110
-
111
-
112
-
113
-
114
-
115
-
116
-
117
-
118
-
119
-
120
-
121
-
122
-
123
-
124
-
125
-
126
-
127
-
128
-
129
-
130
-
131
-
132
-
133
-
134
-
135
-
136
-
137
-
138
-
139
-
140
-
141
-
142
-
143
-
144
-
145
-
146
-
147
-
148
-
149
-
150
-
151
-
152
-
153
-
154
-
155
-
156
-
157
-
158
-
159
-
160
-
161
-
162
-
163
-
164
-
165
-
166
-
167
-
168
-
169
-
170
-
171
-
172
-
173
-
174
-
175
-
176
-
177
-
178
-
179
-
180
-
181
-
182
-
183
-
184
-
185
-
186
-
187
-
188
 |
 |

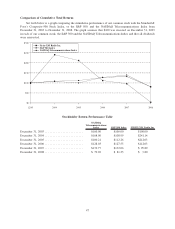
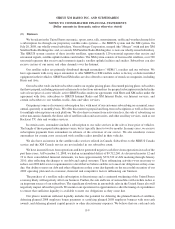
Comparison of Cumulative Total Returns
Set forth below is a graph comparing the cumulative performance of our common stock with the Standard &
Poor’s Composite-500 Stock Index, or the S&P 500, and the NASDAQ Telecommunications Index from
December 31, 2003 to December 31, 2008. The graph assumes that $100 was invested on December 31, 2003
in each of our common stock, the S&P 500 and the NASDAQ Telecommunications Index and that all dividends
were reinvested.
$0
$50
$100
$150
$200
$250
$300
200820072006200512/03 2004
NASDAQ Telecommunications Index
S&P 500 Index
Sirius XM Radio Inc.
Stockholder Return Performance Table
NASDAQ
Telecommunications
Index S&P 500 Index SIRIUS XM Radio Inc.
December 31, 2003 ........................ $100.00 $100.00 $100.00
December 31, 2004 ........................ $108.00 $108.99 $241.14
December 31, 2005 ........................ $100.21 $112.26 $212.03
December 31, 2006 ........................ $128.03 $127.55 $112.03
December 31, 2007 ........................ $139.77 $132.06 $ 95.89
December 31, 2008 ........................ $ 79.69 $ 81.23 $ 3.80
47