Tyson Foods 1999 Annual Report Download - page 57
Download and view the complete annual report
Please find page 57 of the 1999 Tyson Foods annual report below. You can navigate through the pages in the report by either clicking on the pages listed below, or by using the keyword search tool below to find specific information within the annual report.-
 1
1 -
2
-
3
-
4
-
5
-
6
-
7
-
8
-
9
-
10
-
11
-
12
-
13
-
14
-
15
-
16
-
17
-
18
-
19
-
20
-
21
-
22
-
23
-
24
-
25
-
26
-
27
-
28
-
29
-
30
-
31
-
32
-
33
-
34
-
35
-
36
-
37
-
38
-
39
-
40
-
41
-
42
-
43
-
44
-
45
-
46
-
 47
47 -
 48
48 -
 49
49 -
 50
50 -
 51
51 -
 52
52 -
 53
53 -
 54
54 -
 55
55 -
 56
56 -
 57
57 -
 58
58 -
 59
59 -
 60
60 -
 61
61 -
 62
62 -
 63
63 -
 64
64
 |
 |

Notes to consolidated financial statements
TYSON FOODS, INC. 1999 ANNUAL REPORT
55
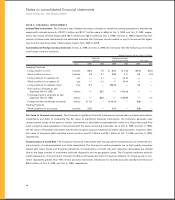
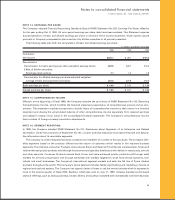
The majority of the Company’s operations are domiciled in the United States. More than 97% of sales to external
customers for the fiscal years ended 1999, 1998 and 1997 were sourced from the United States. Approximately $3 billion
of long-lived assets were located in the United States at fiscal years ended 1999, 1998 and 1997. Approximately $74 mil-
lion, $64 million and $9 million of long-lived assets were located in foreign countries, primarily in Mexico, at fiscal years
ended 1999, 1998 and 1997, respectively.
The Company sells certain of its products in foreign markets, primarily Canada, China, Georgia, Guatemala, Japan,
Puerto Rico, Russia and Singapore as well as certain Middle Eastern and Caribbean countries. The Company’s export sales
for 1999, 1998 and 1997 totaled $546 million, $687 million and $762.5 million, respectively. Substantially all of the
Company’s export sales are transacted through unaffiliated brokers, marketing associations and foreign sales staffs.
Foreign sales were less than 10% of total consolidated sales for 1999, 1998 and 1997, respectively.
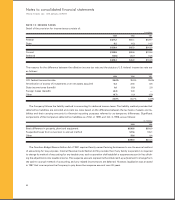
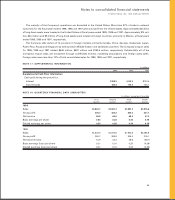
NOTE 17: SUPPLEMENTAL INFORMATION
in millions
1999 1998 1997
Supplemental Cash Flow Information
Cash paid during the period for:
Interest $128.3 $159.9 $123.4
Income taxes 125.4 196.9 124.1
NOTE 18: QUARTERLY FINANCIAL DATA (UNAUDITED)
in millions, except per share data
First Second Third Fourth
quarter quarter quarter quarter
1999
Sales $1,824.7 $1,841.3 $1,881.3 $1,815.6
Gross profit 305.3 322.2 350.2 331.1
Net income 55.8 64.6 68.4 41.3
Basic earnings per share 0.24 0.28 0.30 0.18
Diluted earnings per share 0.24 0.28 0.30 0.18
1998
Sales $1,520.8 $1,870.8 $1,953.6 $2,068.9
Gross profit 260.7 268.8 308.4 316.1
Net income (loss) 44.9 23.3 46.6 (89.7)
Basic earnings (loss) per share 0.21 0.10 0.20 (0.39)
Diluted earnings (loss) per share 0.21 0.10 0.20 (0.39)