Tyson Foods 1999 Annual Report Download - page 52
Download and view the complete annual report
Please find page 52 of the 1999 Tyson Foods annual report below. You can navigate through the pages in the report by either clicking on the pages listed below, or by using the keyword search tool below to find specific information within the annual report.-
 1
1 -
2
-
3
-
4
-
5
-
6
-
7
-
8
-
9
-
10
-
11
-
12
-
13
-
14
-
15
-
16
-
17
-
18
-
19
-
20
-
21
-
22
-
23
-
24
-
25
-
26
-
27
-
28
-
29
-
30
-
31
-
32
-
33
-
34
-
35
-
36
-
37
-
38
-
39
-
40
-
41
-
 42
42 -
 43
43 -
 44
44 -
 45
45 -
 46
46 -
 47
47 -
 48
48 -
 49
49 -
 50
50 -
 51
51 -
 52
52 -
 53
53 -
 54
54 -
 55
55 -
 56
56 -
 57
57 -
 58
58 -
 59
59 -
 60
60 -
 61
61 -
 62
62 -
63
-
64
 |
 |

Notes to consolidated financial statements
TYSON FOODS, INC. 1999 ANNUAL REPORT
50
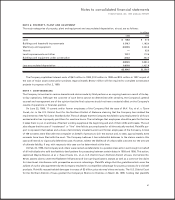
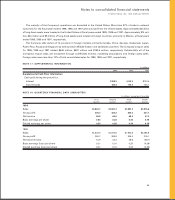
NOTE 10: RESTRICTED STOCK AND STOCK OPTIONS
The Company has outstanding 141,750 restricted shares of Class A stock. The restriction expires over periods ranging
from 10 to 26 years. The unamortized portion of the restricted stock is classified on the Consolidated Balance Sheets as
deferred compensation in shareholders’ equity.
The Company has a nonqualified stock option plan that provides for granting options for shares of Class A stock at a
price not less than the fair market value at the date of grant. The options generally become exercisable ratably over three to
eight years from the date of grant and must be exercised within 10 years of the grant date.
A summary of the Company’s stock option activity for the plan is as follows:
Weighted
average
exercise
Shares price
under option per share
Outstanding, Sept. 28, 1996 5,468,261 $14.55
Exercised (163,906) 13.83
Canceled (560,296) 15.06
Granted 3,598,275 17.92
Outstanding, Sept. 27, 1997 8,342,334 15.99
Exercised (178,467) 14.18
Canceled (313,019) 15.84
Granted 504,700 18.00
Outstanding, Oct. 3, 1998 8,355,548 16.15
Exercised (359,999) 14.23
Canceled (631,717) 16.35
Granted 4,722,500 15.00
Outstanding, Oct. 2, 1999 12,086,332 $15.74
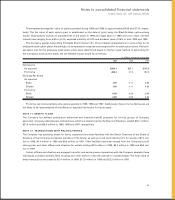
The number of options exercisable was as follows: Oct. 2, 1999–1,870,893, Oct. 3, 1998 –1,202,498 and Sept. 27,
1997– 806,837. The remainder of the options outstanding at Oct. 2, 1999, are exercisable ratably through November 2007.
The number of shares available for future grants was 2,368,619 and 6,459,402 at Oct. 2, 1999, and Oct. 3, 1998, respectively.
The following table summarizes information about stock options outstanding at Oct. 2, 1999:
Options outstanding Options exercisable
Weighted
average Weighted Weighted
Range of remaining average average
exercise Shares contractual exercise Shares exercise
prices outstanding life (in years) price exercisable price
$ 4.82 - 6.58 7,902 3.3 $««6.43 7,902 $««6.43
14.33 -14.50 2,265,105 5.0 14.40 1,485,741 14.40
14.58 -15.17 6,291,350 7.0 15.01 327,750 15.04
17.92 -18.00 3,521,975 7.1 17.93 49,500 17.93
12,086,332 1,870,893