Tyson Foods 1999 Annual Report Download - page 41
Download and view the complete annual report
Please find page 41 of the 1999 Tyson Foods annual report below. You can navigate through the pages in the report by either clicking on the pages listed below, or by using the keyword search tool below to find specific information within the annual report.-
 1
1 -
2
-
3
-
4
-
5
-
6
-
7
-
8
-
9
-
10
-
11
-
12
-
13
-
14
-
15
-
16
-
17
-
18
-
19
-
20
-
21
-
22
-
23
-
24
-
25
-
26
-
27
-
28
-
29
-
30
-
 31
31 -
 32
32 -
 33
33 -
 34
34 -
 35
35 -
 36
36 -
 37
37 -
 38
38 -
 39
39 -
 40
40 -
 41
41 -
 42
42 -
 43
43 -
 44
44 -
 45
45 -
 46
46 -
 47
47 -
 48
48 -
 49
49 -
 50
50 -
 51
51 -
52
-
53
-
54
-
55
-
56
-
57
-
58
-
59
-
60
-
61
-
62
-
63
-
64
 |
 |

39
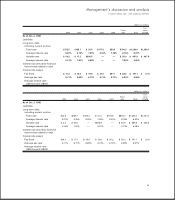
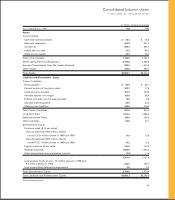
Consolidated balance sheets
TYSON FOODS, INC. 1999 ANNUAL REPORT
in millions, except per share data
Oct. 2, 1999 and Oct. 3, 1998 1999 1998
Assets
Current Assets:
Cash and cash equivalents $«««««30.3 $÷÷«46.5
Accounts receivable 602.5 631.0
Inventories 989.4 984.1
Assets held for sale 74.5 65.2
Other current assets 30.2 38.3
Total Current Assets 1,726.9 1,765.1
Net Property, Plant and Equipment 2,184.5 2,256.5
Excess of Investments Over Net Assets Acquired 962.5 1,035.8
Other Assets 208.8 185.1
Total Assets $5,082.7 $5,242.5
Liabilities and Shareholders’ Equity
Current Liabilities:
Notes payable $÷÷«65.9 $÷÷«84.7
Current portion of long-term debt 222.7 77.6
Trade accounts payable 351.9 330.6
Accrued salaries and wages 102.0 98.4
Federal and state income taxes payable 13.0 0.9
Accrued interest payable 22.9 22.3
Other current liabilities 208.6 216.5
Total Current Liabilities 987.0 831.0
Long-Term Debt 1,515.2 1,966.6
Deferred Income Taxes 398.0 434.4
Other Liabilities 54.5 40.1
Shareholders’ Equity:
Common stock ($.10 par value):
Class A-authorized 900 million shares:
Issued 137.9 million shares in 1999 and 1998 13.8 13.8
Class B-authorized 900 million shares:
Issued 102.7 million shares in 1999 and 1998 10.3 10.3
Capital in excess of par value 740.0 740.5
Retained earnings 1,599.0 1,394.2
Other accumulated comprehensive income (1.5) (1.0)
2,361.6 2,157.8
Less treasury stock, at cost – 12 million shares in 1999 and
9.7 million shares in 1998 232.0 185.1
Less unamortized deferred compensation 1.6 2.3
Total Shareholders’ Equity 2,128.0 1,970.4
Total Liabilities and Shareholders’ Equity $5,082.7 $5,242.5
See accompanying notes.