Tyson Foods 1999 Annual Report Download - page 27
Download and view the complete annual report
Please find page 27 of the 1999 Tyson Foods annual report below. You can navigate through the pages in the report by either clicking on the pages listed below, or by using the keyword search tool below to find specific information within the annual report.-
 1
1 -
2
-
3
-
4
-
5
-
6
-
7
-
8
-
9
-
10
-
11
-
12
-
13
-
14
-
15
-
16
-
 17
17 -
 18
18 -
 19
19 -
 20
20 -
 21
21 -
 22
22 -
 23
23 -
 24
24 -
 25
25 -
 26
26 -
 27
27 -
 28
28 -
 29
29 -
 30
30 -
 31
31 -
 32
32 -
 33
33 -
 34
34 -
 35
35 -
 36
36 -
 37
37 -
38
-
39
-
40
-
41
-
42
-
43
-
44
-
45
-
46
-
47
-
48
-
49
-
50
-
51
-
52
-
53
-
54
-
55
-
56
-
57
-
58
-
59
-
60
-
61
-
62
-
63
-
64
 |
 |

25
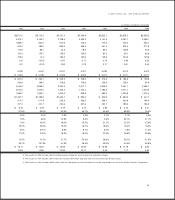
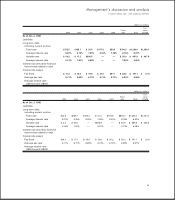
Eleven-year financial summary
TYSON FOODS, INC. 1999 ANNUAL REPORT
in millions, except per share data
1995 1994 1993 1992 1991 1990 1989
$5,511.2 $5,110.3 $4,707.4 $4,168.8 $3,922.1 $3,825.3 $2,538.2
4,423.1 4,149.1 3,796.5 3,390.3 3,147.5 3,081.7 2,056.1
1,088.1 961.2 910.9 778.5 774.6 743.6 482.1
616.4 766.0 535.4 446.8 441.4 423.4 271.5
114.9 86.1 72.8 76.9 95.5 128.6 45.0
131.0 120.7 129.3 100.5 97.0 80.1 62.9
219.2 (2.1) 180.3 160.5 145.5 120.0 100.6
1.01 (0.01) 0.81 0.77 0.70 0.60 0.52
1.01 (0.01) 0.82 0.78 0.71 0.61 0.52
0.053 0.047 0.027 0.027 0.020 0.013 0.013
$«««0.044 $«««0.039 $«««0.022 $«««0.022 $«««0.017 $«««0.011 $«««0.011
$«««347.2 $«««232.1 $«««225.3 $«««108.0 $«««213.6 $«««163.8 $«««128.9
204.9 188.3 176.6 148.9 135.8 123.4 84.8
4,444.3 3,668.0 3,253.5 2,617.7 2,645.8 2,501.1 2,586.1
2,013.5 1,610.0 1,435.3 1,142.2 1,162.0 1,071.1 1,020.8
1,984.7 1,455.1 1,024.3 825.6 984.0 1,020.5 1,374.4
$1,467.7 $1,289.4 $1,360.7 $«««980.2 $«««822.5 $«««663.0 $«««447.7
217.2 217.8 220.9 206.2 206.1 204.9 194.0
217.7 221.7 222.5 207.6 207.1 199.3 194.6
$«««««6.76 $÷÷«5.92 $÷÷«6.16 $÷÷«4.75 $÷÷«3.99 $÷÷«3.24 $÷÷«2.31
57.5% 53.0% 42.9% 45.7% 54.5% 60.6% 75.4%
4.0% 0.0% 3.8% 3.9% 3.7% 3.1% 4.0%
7.9% 8.6% 12.9% 6.3% 2.5% 50.7% 31.1%
7.6% 15.0% 19.5% 18.5% 21.1% 27.5% 27.6%
19.7% 18.8% 19.4% 18.7% 19.8% 19.4% 19.0%
6.0% (0.1) % 6.9% 6.1% 5.8% 4.6% 11.3%
17.0% (0.2) % 18.4% 19.5% 22.0% 26.8% 29.5%
13.8% 14.1% 21.7% 23.9% 26.8% 29.7% 31.8%
38.1% 101.8% 41.8% 38.5% 40.0% 40.0% 38.5%
$«««18.17 $«««16.67 $«««18.08 $«««15.08 $«««15.58 $«««11.79 $«««««8.63
13.83 12.50 12.83 10.17 8.46 7.17 4.92
3. The results for 1998 include a $214.6 million pre-tax charge for asset impairment and other charges.
4. The results for 1997 include a $41 million pre-tax gain ($4 million after-tax) from the sale of the beef division assets.
5. The results for 1994 include a $205 million after-tax charge due to the write-down of certain long-lived assets of Arctic Alaska Fisheries Corporation.