Tyson Foods 1999 Annual Report Download - page 30
Download and view the complete annual report
Please find page 30 of the 1999 Tyson Foods annual report below. You can navigate through the pages in the report by either clicking on the pages listed below, or by using the keyword search tool below to find specific information within the annual report.-
 1
1 -
2
-
3
-
4
-
5
-
6
-
7
-
8
-
9
-
10
-
11
-
12
-
13
-
14
-
15
-
16
-
17
-
18
-
19
-
 20
20 -
 21
21 -
 22
22 -
 23
23 -
 24
24 -
 25
25 -
 26
26 -
 27
27 -
 28
28 -
 29
29 -
 30
30 -
 31
31 -
 32
32 -
 33
33 -
 34
34 -
 35
35 -
 36
36 -
 37
37 -
 38
38 -
 39
39 -
 40
40 -
41
-
42
-
43
-
44
-
45
-
46
-
47
-
48
-
49
-
50
-
51
-
52
-
53
-
54
-
55
-
56
-
57
-
58
-
59
-
60
-
61
-
62
-
63
-
64
 |
 |

Management’s discussion and analysis
TYSON FOODS, INC. 1999 ANNUAL REPORT
28
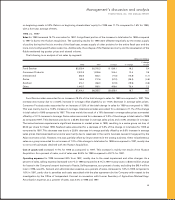
quarter of fiscal 1999. Other miscellaneous sales as a group accounted for a decrease of 3.1% of the change in total sales
for 1999 as compared to 1998, mostly due to the sale of non-core businesses at the end of the first quarter.
Cost of goods sold decreased 3.3% for 1999 as compared to 1998. This decrease is mainly the result of decreased sales
and lower grain costs. As a percent of sales, cost of sales was 82.2% for 1999 compared to 84.4% for 1998 primarily due
to lower grain costs.
Operating expenses for 1999 decreased 13.5% from 1998, mostly due to impairment and other charges of $76.9 million
in 1999 compared to $142.2 million in 1998. As a percent of sales, selling expense decreased to 7.8% in 1999 compared
to 8.7% in 1998, mainly due to the $48.4 million charge in 1998 for losses in the Company’s export business to Russia.
General and administrative expense, as a percent of sales, was 1.8% in 1999 and 1998. Amortization expense, as a per-
cent of sales, was 0.5% in 1999 compared to 0.4% in 1998.
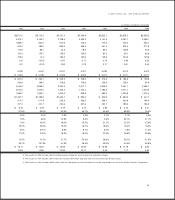
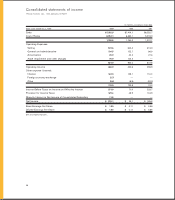
The following is an analysis of segment profit defined as gross profit less selling expenses:
dollars in millions
1999 1998 change
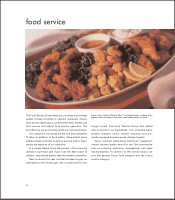
Food Service $311.0 $232.0 $««79.0
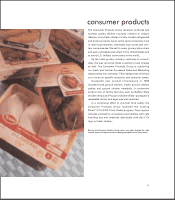
Consumer Products 241.7 179.3 62.4
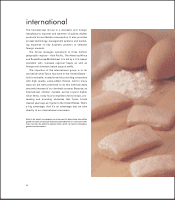
International 67.5 8.4 59.1
Swine (63.0) (20.7) (42.3)
Seafood 22.2 3.2 19.0
Other 154.8 109.6 45.2
$734.2 $511.8 $222.4
Food Service segment profit increased 34.1% to $311 million mostly due to lower grain prices, a 2.6% increase in tonnage
and a change in product mix. Consumer Products segment profits increased 34.8% to $241.7 million also due to lower grain
prices and a 10.5% increase in tonnage. International segment profits increased $59.1 million to $67.5 million due to the con-
solidation of Tyson de Mexico in 1999 resulting in a 29.6% increase in tonnage. Swine segment loss increased $42.3 million
to a loss of $63 million due to depressed market conditions. Swine average sales prices decreased 23.2% compared to the
same period last year. Seafood segment profits increased $19 million to $22.2 million largely due to a 4.9% increase in aver-
age sales prices offset somewhat by decreased tonnage due to the sale of the seafood business at the end of the third quarter.
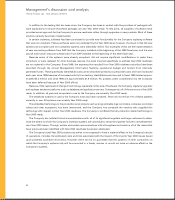
Interest expense decreased 10.9% in 1999 compared to 1998. As a percent of sales, interest
expense was 1.7% in 1999 compared to 1.9% in 1998. The Company had a lower level of bor-
rowing in 1999, which decreased the Company’s average indebtedness by 6.4% over the same
period last year. The Company’s short-term interest rates were slightly lower than the same
period last year, and the net average effective interest rate on total debt for 1999 was 6.2%
compared to 6.6% for 1998.
The effective tax rate for 1999 was 34.9% compared to 64.7% for 1998. The effective tax rate for
1999 has decreased due in part to Tyson de Mexico earnings being taxed at the applicable for-
eign rate. The 1998 effective tax rate was affected by certain costs related to asset impairment
and foreign losses not deductible for tax purposes.
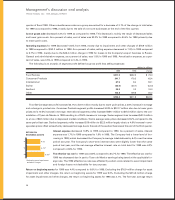
Return on beginning assets for 1999 was 4.4% compared to 0.6% for 1998. Excluding the $76.9 million charge for asset
impairment and other charges, the return on beginning assets for 1999 was 5.3%. Excluding the $214.6 million charge
for asset impairment and other charges, the return on beginning assets for 1998 was 4.1%. The five-year average return
‘97
‘98
‘99
4.1%
4.1%*
5.3%*
*Excluding asset impairment
and other charges.
RETURN ON
BEGINNING ASSETS