Tyson Foods 1999 Annual Report Download - page 26
Download and view the complete annual report
Please find page 26 of the 1999 Tyson Foods annual report below. You can navigate through the pages in the report by either clicking on the pages listed below, or by using the keyword search tool below to find specific information within the annual report.-
 1
1 -
2
-
3
-
4
-
5
-
6
-
7
-
8
-
9
-
10
-
11
-
12
-
13
-
14
-
15
-
 16
16 -
 17
17 -
 18
18 -
 19
19 -
 20
20 -
 21
21 -
 22
22 -
 23
23 -
 24
24 -
 25
25 -
 26
26 -
 27
27 -
 28
28 -
 29
29 -
 30
30 -
 31
31 -
 32
32 -
 33
33 -
 34
34 -
 35
35 -
 36
36 -
37
-
38
-
39
-
40
-
41
-
42
-
43
-
44
-
45
-
46
-
47
-
48
-
49
-
50
-
51
-
52
-
53
-
54
-
55
-
56
-
57
-
58
-
59
-
60
-
61
-
62
-
63
-
64
 |
 |

24
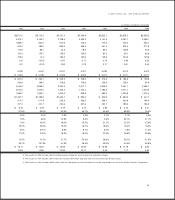
Eleven-year financial summary
TYSON FOODS, INC. 1999 ANNUAL REPORT
1999 1998 1997 1996
Operating Results for Fiscal Year
Sales $7,362.9 $7,414.1 $6,355.7 $6,453.8
Cost of sales 6,054.1 6,260.1 5,318.0 5,505.7
Gross profit 1,308.8 1,154.0 1,037.7 948.1
Operating expenses 821.9 950.4 637.8 678.5
Interest expense 124.0 139.1 110.4 132.9
Provision for income taxes 129.4 45.9 143.9 49.0
Net income (loss) 230.1 25.1 185.8 86.9
Diluted earnings (loss) per share 1.00 0.11 0.85 0.40
Basic earnings (loss) per share 1.00 0.11 0.86 0.40
Dividends per share:
Class A 0.115 0.100 0.095 0.080
Class B $«««0.104 $«««0.090 $«««0.086 $«««0.072
Capital expenditures $«««363.3 $«««310.4 $«««291.2 $«««214.0
Depreciation and amortization 291.1 276.4 230.4 239.3
Total assets 5,082.7 5,242.5 4,411.0 4,544.1
Net property, plant and equipment 2,184.5 2,256.5 1,924.8 1,869.2
Total debt 1,803.8 2,128.9 1,690.1 1,975.1
Shareholders’ equity $2,128.0 $1,970.4 $1,621.5 $1,541.7
Year end shares outstanding 228.6 230.9 213.4 217.4
Diluted average shares outstanding 231.0 227.9 218.2 218.0
Book value per share $«««««9.31 $«««««8.53 $÷÷«7.60 $«««««7.09
Total debt to capitalization 45.9% 51.9% 51.0% 56.2%
Return on sales 3.1% 0.3% 2.9% 1.4%
Annual sales growth (decline) (0.7) % 16.7% (1.5) % 17.1%
Five-year compounded annual sales growth 7.6% 9.5% 8.8% 10.5%
Gross margin 17.8% 15.6% 16.3% 14.7%
Return on beginning assets 4.4% 0.6% 4.1% 2.0%
Return on beginning shareholders’ equity 11.7% 1.5% 12.1% 5.9%
Five-year return on beginning
shareholders’ equity 9.6% 7.1% 10.1% 10.9%
Effective tax rate 34.9% 64.7% 43.6% 37.0%
Closing stock price high $«««25.38 $«««24.44 $«««23.63 $÷«18.58
Closing stock price low 15.00 16.50 17.75 13.83
1. The results for 1999 include a $19.2 million pre-tax charge for loss on sale of seafood assets, a $35.2 million pre-tax impairment charge for loss on
the anticipated sale of The Pork Group and a $22.5 million pre-tax charge for write-down of impaired assets of Mallard’s Food Products.
2. Significant business combinations accounted for as purchases: Hudson Foods, Inc., Arctic Alaska Fisheries Corporation and Holly Farms Corporation
on Jan. 9, 1998, Oct. 5, 1992, and July 19, 1989, respectively. See Footnote 3 to the Consolidated Financial Statements for acquisitions during the
three-year period ended Oct. 2, 1999.