Tyson Foods 1999 Annual Report Download - page 29
Download and view the complete annual report
Please find page 29 of the 1999 Tyson Foods annual report below. You can navigate through the pages in the report by either clicking on the pages listed below, or by using the keyword search tool below to find specific information within the annual report.
Management’s discussion and analysis
TYSON FOODS, INC. 1999 ANNUAL REPORT
27
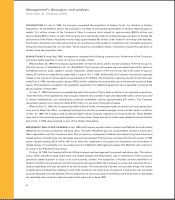
In 1998, as a result of the restructuring, the Company recorded pretax charges totaling $214.6 million ($0.68 per share)
consisting of $142.2 million for asset impairment of property, plant and equipment, write-down of related excess of invest-
ments over net assets acquired and severance costs, $48.4 million for losses in the Company’s export business to Russia,
which had been adversely affected by the continuing economic problems in Russia, and $24 million for other charges
related primarily to workers compensation and employment practice liabilities. These charges were classified in the
Consolidated Statements of Income as $142.2 million asset impairment and other charges, $48.4 million in selling expenses,
$20.5 million in cost of sales and $3.5 million in other expense. During the fourth quarter of 1998, the Russian Ruble deval-
ued resulting in the losses described above. The Company recognizes that conducting business in or selling products into
foreign countries, including Russia, entails inherent risks. The Company, however, is continually monitoring its interna-
tional business practices and, whenever possible, will attempt to minimize the Company’s financial exposure to these risks.
RESULTS OF OPERATIONS The Company’s accounting cycle resulted in a 52-week year for both 1999 and 1997 com-
pared to a 53-week year for 1998.
1999 vs. 1998
Sales for 1999 decreased 0.7% from sales for 1998. The operating results for 1999 were affected negatively by the excess
supply of chicken and other meats during the last six months of the fiscal year, offset somewhat by the volume gained
from the Hudson Acquisition and the inclusion of Tyson de Mexico on a consolidated basis. Management anticipates this
excess supply of all meats will continue through the first six months of fiscal 2000.
The following is an analysis of net sales by segment:
dollars in millions
% change
1999 1998 change % change of total
Food Service $3,353.9 $3,329.4 $«««24.5 0.7 0.3
Consumer Products 2,251.9 2,074.0 177.9 8.6 2.4
International 645.2 592.5 52.7 8.9 0.7
Swine 109.5 160.4 (50.9) (31.7) (0.7)
Seafood 189.2 214.1 (24.9) (11.6) (0.3)
Other 813.2 1,043.7 (230.5) (22.1) (3.1)
$7,362.9 $7,414.1 $««(51.2) (0.7) (0.7)
Food Service sales accounted for an increase of 0.3% of the total change in sales for 1999 as compared to 1998. This
increase was mainly due to a 2.6% increase in tonnage offset mostly by a 1.8% decrease in average sales prices. Consumer
Products sales accounted for an increase of 2.4% of the total change in sales for 1999 as com-
pared to 1998. This increase was mainly due to a 10.5% increase in tonnage largely offset by a
1.8% decrease in average sales prices. International sales accounted for an increase of 0.7% of the
change in total sales in 1999. This increase is mostly the result of a 29.6% increase in tonnage off-
set by a 15.9% decrease in average sales prices. The increase in tonnage for the international
segment is mainly due to the consolidation of Tyson de Mexico. Swine sales accounted for a
decrease of 0.7% of the change in total sales for 1999 as compared to last year. The swine busi-
ness experienced a significant decrease in market prices during fiscal 1999 compared to fiscal
1998, resulting in a swine group net loss of $0.18 per share for fiscal 1999. Seafood sales
accounted for a decrease of 0.3% of the change in total sales for 1999 as compared to 1998. This
decrease mostly was due to the sale of the seafood business at the beginning of the fourth
■selling
■general & administrative
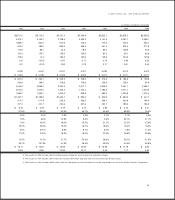
EXPENSES AS A
PERCENT OF SALES
*Excludes $48.4 million loss


