Tyson Foods 1999 Annual Report Download - page 53
Download and view the complete annual report
Please find page 53 of the 1999 Tyson Foods annual report below. You can navigate through the pages in the report by either clicking on the pages listed below, or by using the keyword search tool below to find specific information within the annual report.-
 1
1 -
2
-
3
-
4
-
5
-
6
-
7
-
8
-
9
-
10
-
11
-
12
-
13
-
14
-
15
-
16
-
17
-
18
-
19
-
20
-
21
-
22
-
23
-
24
-
25
-
26
-
27
-
28
-
29
-
30
-
31
-
32
-
33
-
34
-
35
-
36
-
37
-
38
-
39
-
40
-
41
-
42
-
 43
43 -
 44
44 -
 45
45 -
 46
46 -
 47
47 -
 48
48 -
 49
49 -
 50
50 -
 51
51 -
 52
52 -
 53
53 -
 54
54 -
 55
55 -
 56
56 -
 57
57 -
 58
58 -
 59
59 -
 60
60 -
 61
61 -
 62
62 -
 63
63 -
64
 |
 |

51
Notes to consolidated financial statements
TYSON FOODS, INC. 1999 ANNUAL REPORT
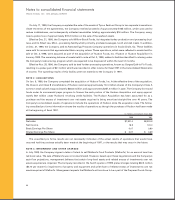
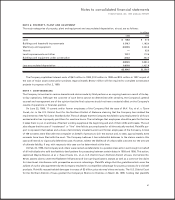
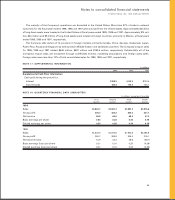
The weighted average fair value of options granted during 1999 and 1998 is approximately $5.06 and $7.10, respec-
tively. The fair value of each option grant is established on the date of grant using the Black-Scholes option-pricing
model. Assumptions include an expected life of 5.5 years in 1999 and eight years in 1998 and prior years, risk-free
interest rates ranging from 5.5% to 6.4%, expected volatility of 0.2% and dividend yield of 0.5% in both 1999 and 1998.
The Company applies Accounting Principles Board Opinion No. 25 and related interpretations in accounting for its
employee stock option plans. Accordingly, no compensation expense was recognized for its stock option plans. Had com-
pensation cost for the employee stock option plans been determined based on the fair value method of accounting for
the Company’s stock option plans, the tax-effected impact would be as follows:
in millions, except per share data
1999 1998 1997
Net Income
As reported $230.1 $25.1 $185.8
Pro forma 226.3 21.0 182.0
Earnings Per Share
As reported
Basic 1.00 0.11 0.86
Diluted 1.00 0.11 0.85
Pro forma
Basic 0.98 0.09 0.84
Diluted 0.98 0.09 0.83
Pro forma net income reflects only options granted in 1999, 1998 and 1997. Additionally, the pro forma disclosures are
not likely to be representative of the effects on reported net income for future years.
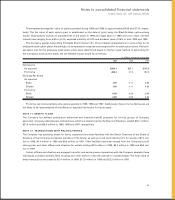
NOTE 11: BENEFIT PLANS
The Company has defined contribution retirement and incentive benefit programs for various groups of Company
personnel. Company discretionary contributions, which are determined by the Board of Directors, totaled $33.1 million,
$31.8 million and $26.8 million in 1999, 1998 and 1997, respectively.
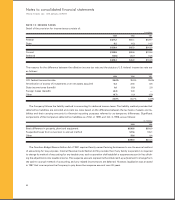
NOTE 12: TRANSACTIONS WITH RELATED PARTIES
The Company has operating leases for farms, equipment and other facilities with the Senior Chairman of the Board of
Directors of the Company and certain members of his family, as well as a trust controlled by him, for rentals of $7.4 mil-
lion in 1999, $5.4 million in 1998 and $5.6 million in 1997. Other facilities have been leased from the Company’s profit
sharing plan and other officers and directors for rentals totaling $3.3 million in 1999, $3.4 million in 1998 and $5.3 mil-
lion in 1997.
Certain officers and directors are engaged in poultry and swine growout operations with the Company whereby these
individuals purchase animals, feed, housing and other items to raise the animals to market weight. The total value of
these transactions amounted to $10.4 million in 1999, $11.5 million in 1998 and $12.3 million in 1997.