Tyson Foods 1999 Annual Report Download - page 31
Download and view the complete annual report
Please find page 31 of the 1999 Tyson Foods annual report below. You can navigate through the pages in the report by either clicking on the pages listed below, or by using the keyword search tool below to find specific information within the annual report.-
 1
1 -
2
-
3
-
4
-
5
-
6
-
7
-
8
-
9
-
10
-
11
-
12
-
13
-
14
-
15
-
16
-
17
-
18
-
19
-
20
-
 21
21 -
 22
22 -
 23
23 -
 24
24 -
 25
25 -
 26
26 -
 27
27 -
 28
28 -
 29
29 -
 30
30 -
 31
31 -
 32
32 -
 33
33 -
 34
34 -
 35
35 -
 36
36 -
 37
37 -
 38
38 -
 39
39 -
 40
40 -
 41
41 -
42
-
43
-
44
-
45
-
46
-
47
-
48
-
49
-
50
-
51
-
52
-
53
-
54
-
55
-
56
-
57
-
58
-
59
-
60
-
61
-
62
-
63
-
64
 |
 |

on beginning assets is 3.3%. Return on beginning shareholders’ equity for 1999 was 11.7% compared to 1.5% for 1998,
with a five-year average of 9.6%.
1998 vs. 1997
Sales for 1998 increased 16.7% over sales for 1997. A significant portion of the increase in total sales for 1998 compared
to 1997 is due to the Hudson Acquisition. The operating results for 1998 were affected negatively by the excess supply
of poultry during the first six months of the fiscal year, excess supply of other proteins for the entire fiscal year and the
more commodity-based Hudson sales mix. Additionally, the collapse of the Russian economy and the devaluation of the
Ruble weakened leg quarter prices and slowed volume.
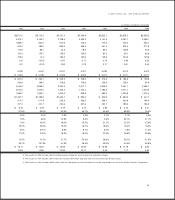
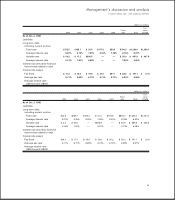
The following is an analysis of net sales by segment:
dollars in millions
% change
1998 1997 change % change of total
Food Service $3,329.4 $2,793.3 $÷«536.1 19.2 8.4
Consumer Products 2,074.0 1,829.6 244.4 13.4 3.9
International 592.5 664.1 (71.6) (10.8) (1.1)
Swine 160.4 217.6 (57.2) (26.3) (0.9)
Seafood 214.1 266.0 (51.9) (19.5) (0.8)
Other 1,043.7 585.1 458.6 78.4 7.2
$7,414.1 $6,355.7 $1,058.4 16.7 16.7
Food Service sales accounted for an increase of 8.4% of the total change in sales for 1998 as compared to 1997. This
increase was mainly due to a 34.9% increase in tonnage offset slightly by an 11.6% decrease in average sales prices.
Consumer Products sales accounted for an increase of 3.9% of the total change in sales for 1999 as compared to 1998.
This was mainly due to a 13.5% increase in tonnage. International sales accounted for a decrease of 1.1% of the change
in total sales for 1998 compared to 1997. This was mainly the result of a 19% decrease in average sales prices somewhat
offset by a 10.1% increase in tonnage. Swine sales accounted for a decrease of 0.9% of the change in total sales for 1998
as compared 1997. This decrease was due to a 25.6% decrease in average sales prices and a 0.9% decrease in tonnage.
The swine business experienced a significant decrease in market prices in 1998, resulting in a swine group net loss of
$0.06 per share for fiscal 1998. Seafood sales accounted for a decrease of 0.8% of the change in total sales for 1998 as
compared to 1997. This decrease was due to a 25.9% decrease in tonnage partially offset by an 8.6% increase in average
sales prices. Decreased seafood volume was mainly due to weakness in the surimi business caused in large part by the
Asian economic crisis. However, this was partially offset by improvements in the analog business. Other miscellaneous
sales as a group accounted for an increase of 7.2% of the change in total sales for 1998 as compared to 1997, mostly due
to non-core businesses obtained with the Hudson Acquisition.
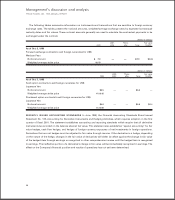
Cost of goods sold increased 17.7% for 1998 as compared to 1997. This increase is mainly the result of the Hudson
Acquisition. As a percent of sales, cost of sales was 84.4% for 1998 compared to 83.7% for 1997.
Operating expenses for 1998 increased 49% from 1997, mostly due to the asset impairment and other charges. As a
percent of sales, selling expense increased to 8.7% in 1998 compared to 8.1% in 1997 mainly due to a $48.4 million charge
for losses in the Company’s export business to Russia. Selling expense, as a percent of sales, excluding the $48.4 million
loss in 1998, was 8%. General and administrative expense, as a percent of sales, increased to 1.8% in 1998 compared to
1.6% in 1997, partly due to penalties and costs associated with the plea agreement by the Company with respect to the
investigation by the Office of Independent Counsel in connection with former Secretary of Agriculture Michael Espy.
Amortization expense, as a percent of sales, was 0.4% in 1998 and 1997.
Management’s discussion and analysis
TYSON FOODS, INC. 1999 ANNUAL REPORT
29