Tyson Foods 1999 Annual Report Download - page 48
Download and view the complete annual report
Please find page 48 of the 1999 Tyson Foods annual report below. You can navigate through the pages in the report by either clicking on the pages listed below, or by using the keyword search tool below to find specific information within the annual report.-
 1
1 -
2
-
3
-
4
-
5
-
6
-
7
-
8
-
9
-
10
-
11
-
12
-
13
-
14
-
15
-
16
-
17
-
18
-
19
-
20
-
21
-
22
-
23
-
24
-
25
-
26
-
27
-
28
-
29
-
30
-
31
-
32
-
33
-
34
-
35
-
36
-
37
-
 38
38 -
 39
39 -
 40
40 -
 41
41 -
 42
42 -
 43
43 -
 44
44 -
 45
45 -
 46
46 -
 47
47 -
 48
48 -
 49
49 -
 50
50 -
 51
51 -
 52
52 -
 53
53 -
 54
54 -
 55
55 -
 56
56 -
 57
57 -
 58
58 -
59
-
60
-
61
-
62
-
63
-
64
 |
 |

Notes to consolidated financial statements
TYSON FOODS, INC. 1999 ANNUAL REPORT
46
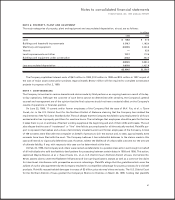
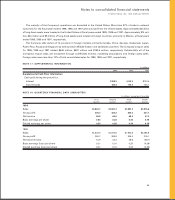
NOTE 5: FINANCIAL INSTRUMENTS
Interest Rate Instruments: The Company uses interest rate swap contracts on certain borrowing transactions. Interest rate
swaps with notional amounts of $127.1 million and $141.7 million were in effect at Oct. 2, 1999, and Oct. 3, 1998, respec-
tively. Fair values of these swaps were ($0.7) million and ($8.1) million at Oct. 2, 1999, and Oct. 3, 1998, respectively. Fair
values of interest rate instruments are estimated amounts the Company would receive or pay to terminate the agree-
ments at the reporting dates. These swaps mature from 2005 to 2008.
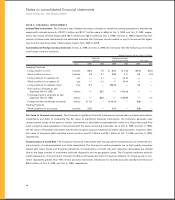
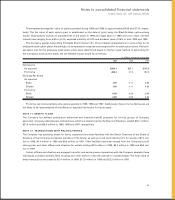
Commodity and Foreign Currency Contracts: At Oct. 2, 1999, and Oct. 3, 1998, the Company held the following commodity
and foreign currency contracts:
notional amounts and fair values in millions
Notional Weighted average
amount contract/strike price Fair value
Units 1999 1998 1999 1998 1999 1998
Hedging Positions
Long position in corn bushels 84.4 7.5 $««««2.21 $««2.33 $(7.7) $(0.4)
Short position in corn bushels 1.4 9.7 2.32 2.11 0.3 (0.3)
Long positions in soybean oil cwt —0.1 —24.24 ——
Short positions in soybean oil cwt —0.1 —24.40 ——
Long positions in soybean meal tons 0.1 —143.14 —0.4 —
Sold option contracts to sell
Japanese Yen for US$ dollars —$6.5 —¥109.48 ——
Purchased option contracts to sell
Japanese Yen for US$ dollars —$5.6 —¥126.69 —0.4
Foreign forward exchange contracts dollars $ 7.3 —$ 10.13 —(0.6) —
Trading Positions
Short positions in corn puts bushels 27.5 —2.10 —(2.5) —
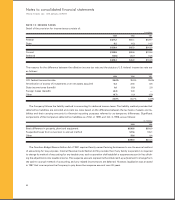
Fair Value of Financial Instruments: The Company’s significant financial instruments include cash and cash equivalents,
investments and debt. In evaluating the fair value of significant financial instruments, the Company generally uses
quoted market prices of the same or similar instruments or calculates an estimated fair value on a discounted cash flow
basis using the rates available for instruments with the same remaining maturities. As of Oct. 2, 1999, and Oct. 3, 1998,
the fair value of financial instruments held by the Company approximated the recorded value except for long-term debt.
Fair value of long-term debt including current portion was $1.7 billion and $2.1 billion at Oct. 2, 1999, and Oct. 3, 1998,
respectively.
Concentrations of Credit Risk: The Company’s financial instruments that are exposed to concentrations of credit risk con-
sist primarily of cash equivalents and trade receivables. The Company’s cash equivalents are in high quality securities
placed with major banks and financial institutions. Concentrations of credit risk with respect to receivables are limited
due to the large number of customers and their dispersion across geographic areas. The Company performs periodic
credit evaluations of its customers’ financial condition and generally does not require collateral. No single group or cus-
tomer represents greater than 10% of total accounts receivable. Allowance for doubtful accounts was $21.8 million and
$85.3 million at Oct. 2, 1999, and Oct. 3, 1998, respectively.