Tyson Foods 1999 Annual Report Download - page 56
Download and view the complete annual report
Please find page 56 of the 1999 Tyson Foods annual report below. You can navigate through the pages in the report by either clicking on the pages listed below, or by using the keyword search tool below to find specific information within the annual report.-
 1
1 -
2
-
3
-
4
-
5
-
6
-
7
-
8
-
9
-
10
-
11
-
12
-
13
-
14
-
15
-
16
-
17
-
18
-
19
-
20
-
21
-
22
-
23
-
24
-
25
-
26
-
27
-
28
-
29
-
30
-
31
-
32
-
33
-
34
-
35
-
36
-
37
-
38
-
39
-
40
-
41
-
42
-
43
-
44
-
45
-
 46
46 -
 47
47 -
 48
48 -
 49
49 -
 50
50 -
 51
51 -
 52
52 -
 53
53 -
 54
54 -
 55
55 -
 56
56 -
 57
57 -
 58
58 -
 59
59 -
 60
60 -
 61
61 -
 62
62 -
 63
63 -
 64
64
 |
 |

Notes to consolidated financial statements
TYSON FOODS, INC. 1999 ANNUAL REPORT
54
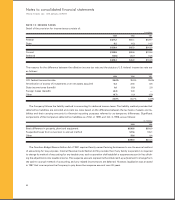
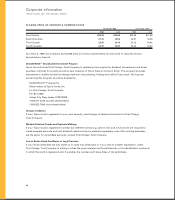
The Company measures segment profit as gross profit less selling expenses. The majority of revenue included in the
other category is derived from the Company’s specialty products and prepared foods groups, the Company’s wholly-
owned subsidiaries involved in supplying poultry breeding stock and trading agricultural goods worldwide as well as the
Company’s turkey and egg products facilities which were sold on Dec. 31, 1998. Sales between reportable segments are
recorded at cost. The majority of identifiable assets in the other category includes excess of investments over net assets
acquired, investments and other assets and other corporate unallocated assets.
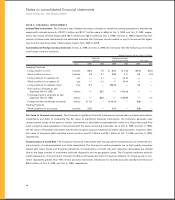
Information on segments and a reconciliation to income before taxes and minority interest are as follows:
in millions
Food Consumer
Service Products International Swine Seafood Other Consolidated
Fiscal year ended Oct. 2, 1999
Sales $3,353.9 $2,251.9 $645.2 $109.5 $189.2 $«««813.2 $7,362.9
Gross profit less selling expenses 311.0 241.7 67.5 (63.0) 22.2 154.8 734.2
Other operating expenses 247.3
Other expense 115.9
Income before taxes on income
and minority interest 371.0
Depreciation 114.2 57.6 0.7 3.8 28.7 50.2 255.2
Asset impairment and other charges ———35.2 19.2 22.5 76.9
Identifiable assets 1,924.8 1,161.4 194.0 70.0 — 1,732.5 5,082.7
Additions to property, plant
and equipment 153.2 129.8 15.5 4.5 6.1 54.2 363.3
Fiscal year ended Oct. 3, 1998
Sales $3,329.4 $2,074.0 $592.5 $160.4 $214.1 $1,043.7 $7,414.1
Gross profit less selling expenses 232.0 179.3 8.4 (20.7) 3.2 109.6 511.8
Other operating expenses 308.2
Other expense 132.6
Income before taxes on income
and minority interest 71.0
Depreciation 108.1 62.1 1.2 3.7 22.8 45.2 243.1
Asset impairment and other charges 50.7 38.6 48.3 — 47.0 30.0 214.6
Identifiable assets 1,822.2 1,037.7 188.4 128.2 221.0 1,845.0 5,242.5
Additions to property, plant
and equipment 154.6 69.0 0.1 5.0 26.9 54.8 310.4
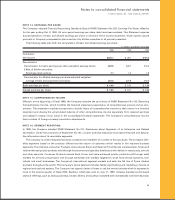
Fiscal year ended Sept. 27, 1997
Sales $2,793.3 $1,829.6 $664.1 $217.6 $266.0 $÷«585.1 $6,355.7
Gross profit less selling expenses 187.9 108.3 28.5 22.8 24.3 152.6 524.4
Other operating expenses 124.5
Other expense 70.2
Income before taxes on income
and minority interest 329.7
Depreciation 84.6 49.6 1.1 3.5 20.8 43.2 202.8
Identifiable assets 1,538.3 824.2 179.9 134.6 288.1 1,445.9 4,411.0
Additions to property, plant
and equipment 168.8 49.3 0.4 3.6 21.7 47.4 291.2