Tyson Foods 1999 Annual Report Download - page 43
Download and view the complete annual report
Please find page 43 of the 1999 Tyson Foods annual report below. You can navigate through the pages in the report by either clicking on the pages listed below, or by using the keyword search tool below to find specific information within the annual report.-
 1
1 -
2
-
3
-
4
-
5
-
6
-
7
-
8
-
9
-
10
-
11
-
12
-
13
-
14
-
15
-
16
-
17
-
18
-
19
-
20
-
21
-
22
-
23
-
24
-
25
-
26
-
27
-
28
-
29
-
30
-
31
-
32
-
 33
33 -
 34
34 -
 35
35 -
 36
36 -
 37
37 -
 38
38 -
 39
39 -
 40
40 -
 41
41 -
 42
42 -
 43
43 -
 44
44 -
 45
45 -
 46
46 -
 47
47 -
 48
48 -
 49
49 -
 50
50 -
 51
51 -
 52
52 -
 53
53 -
54
-
55
-
56
-
57
-
58
-
59
-
60
-
61
-
62
-
63
-
64
 |
 |

41
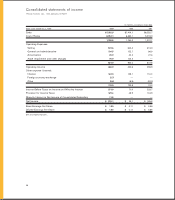
Consolidated statements of cash flows
TYSON FOODS, INC. 1999 ANNUAL REPORT
in millions
three years ended Oct. 2, 1999 1999 1998 1997
Cash Flows From Operating Activities:
Net income $«230.1 $÷÷«25.1 $«185.8
Adjustments to reconcile net income
to cash provided by operating activities:
Depreciation 255.2 243.1 202.8
Amortization 35.9 33.3 27.6
Asset impairment and other charges 76.9 214.6 —
Deferred income taxes (13.5) (144.5) 10.5
Minority interest 11.5 — —
Foreign currency exchange loss (2.7) — —
Gain on dispositions of property, plant and equipment (0.5) (2.3) (34.8)
Decrease (increase) in accounts receivable 24.8 32.8 (68.4)
(Increase) decrease in inventories (98.8) 79.8 143.6
Increase (decrease) in trade accounts payable 20.4 (6.6) 19.2
Net change in other current assets and liabilities 7.4 21.1 54.7
Cash Provided by Operating Activities 546.7 496.4 541.0
Cash Flows From Investing Activities:
Net cash paid for acquisitions —(258.5) (4.3)
Additions to property, plant and equipment (363.3) (310.4) (291.2)
Proceeds from sale of assets 233.8 136.0 223.4
Net change in other assets and liabilities (36.4) (13.3) (63.8)
Cash Used for Investing Activities (165.9) (446.2) (135.9)
Cash Flows From Financing Activities:
Decrease in notes payable (18.8) (74.4) (2.2)
Proceeds from long-term debt 76.1 1,027.1 131.4
Repayments of long-term debt (382.4) (954.7) (420.8)
Purchase of treasury shares (52.1) (22.3) (109.6)
Other (17.6) (2.9) (17.2)
Cash Used for Financing Activities (394.8) (27.2) (418.4)
Effect of Exchange Rate Change on Cash (2.2) (0.1) 0.3
(Decrease) Increase in Cash (16.2) 22.9 (13.0)
Cash and Cash Equivalents at Beginning of Year 46.5 23.6 36.6
Cash and Cash Equivalents at End of Year $«««30.3 $«««««46.5 $«««23.6
See accompanying notes.