Tyson Foods 1999 Annual Report Download - page 32
Download and view the complete annual report
Please find page 32 of the 1999 Tyson Foods annual report below. You can navigate through the pages in the report by either clicking on the pages listed below, or by using the keyword search tool below to find specific information within the annual report.-
 1
1 -
2
-
3
-
4
-
5
-
6
-
7
-
8
-
9
-
10
-
11
-
12
-
13
-
14
-
15
-
16
-
17
-
18
-
19
-
20
-
21
-
 22
22 -
 23
23 -
 24
24 -
 25
25 -
 26
26 -
 27
27 -
 28
28 -
 29
29 -
 30
30 -
 31
31 -
 32
32 -
 33
33 -
 34
34 -
 35
35 -
 36
36 -
 37
37 -
 38
38 -
 39
39 -
 40
40 -
 41
41 -
 42
42 -
43
-
44
-
45
-
46
-
47
-
48
-
49
-
50
-
51
-
52
-
53
-
54
-
55
-
56
-
57
-
58
-
59
-
60
-
61
-
62
-
63
-
64
 |
 |

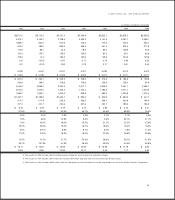
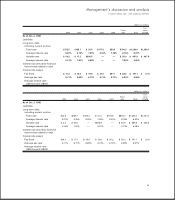
The following is an analysis of segment profit defined as gross profit less selling expenses:
dollars in millions
1998 1997 change
Food Service $232.0 $187.9 $«44.1
Consumer Products 179.3 108.3 71.0
International 8.4 28.5 (20.1)
Swine (20.7) 22.8 (43.5)
Seafood 3.2 24.3 (21.1)
Other 109.6 152.6 (43.0)
$511.8 $524.4 $(12.6)
Food Service segment profit increased 23.5% to $232 million mostly due to lower grain prices, a 34.9% increase in
tonnage and a change in product mix. Consumer Products segment profits increased 65.6% to $179.3 million also due to
lower grain prices and a 13.5% increase in tonnage. International segment profits decreased $20.1 million to $8.4 million
due to a 19% decrease in average sales prices. Swine segment loss increased $43.5 million to a loss of $20.7 million due
to depressed market conditions. Swine average sales prices decreased 25.6% compared to the same period last year.
Seafood segment profits decreased $21.1 million to $3.2 million largely due to a 25.9% decrease in tonnage offset some-
what by an 8.6% increase in average sales prices.
Interest expense increased 26% in 1998 compared to 1997. As a percent of sales, interest expense was 1.9% in 1998 com-
pared to 1.7% in 1997. The Company had a higher level of borrowing in 1998, which increased the Company’s average
indebtedness by 18% over the same period last year mainly due to the Hudson Acquisition. The Company’s short-term
interest rates were slightly higher than the same period last year, and the net average effective interest rate on total debt
for 1998 was 6.6% compared to 6.2% for 1997.
The effective tax rate for 1998 was 64.7% compared to 43.6% for 1997. The 1998 effective tax rate was affected by certain
costs related to asset impairment and foreign losses not deductible for tax purposes. The 1997 effective tax rate was
affected by the taxes on the gain from the sale of the beef division assets. Certain costs were allocated to the beef divi-
sion which were not deductible for tax purposes, resulting in a higher effective tax rate.
Return on beginning assets for 1998 was 0.6% compared to 4.1% for 1997, with a five-year average of 2.5%. Return on begin-
ning assets for 1998, excluding the $214.6 million for asset impairment and other charges, was 4.1%. Return on beginning
shareholders’ equity for 1998 was 1.5% compared to 12.1% for 1997, with a five-year average of 7.1%. Return on begin-
ning shareholders’ equity for 1998, excluding the $214.6 million for asset impairment and other charges, was 11.1%.
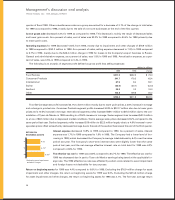
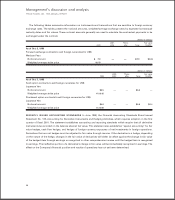
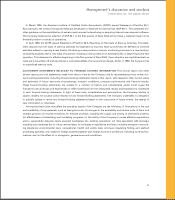
LIQUIDITY AND CAPITAL RESOURCES Cash provided by operations continues to be the
Company’s primary source of funds to finance operating needs and capital expenditures. In
1999, net cash of $546.7 million was provided by operating activities, an increase of $50.3 mil-
lion from 1998. The Company used cash from operations to pay down debt and to fund
additions to property, plant and equipment. The expenditures for property, plant and equip-
ment were related to acquiring new equipment, upgrading facilities to maintain competitive
standing and to position the Company for future opportunities. Additionally, the Company
makes a continuing effort to increase efficiencies, reduce overall cost and meet or exceed
environmental laws and regulations, which requires investments.
Management’s discussion and analysis
TYSON FOODS, INC. 1999 ANNUAL REPORT
30
‘97
‘98
‘99
$541.0
$496.4
$546.7
CASH PROVIDED BY
OPERATING ACTIVITIES
dollars in millions