Tyson Foods 1999 Annual Report Download - page 40
Download and view the complete annual report
Please find page 40 of the 1999 Tyson Foods annual report below. You can navigate through the pages in the report by either clicking on the pages listed below, or by using the keyword search tool below to find specific information within the annual report.-
 1
1 -
2
-
3
-
4
-
5
-
6
-
7
-
8
-
9
-
10
-
11
-
12
-
13
-
14
-
15
-
16
-
17
-
18
-
19
-
20
-
21
-
22
-
23
-
24
-
25
-
26
-
27
-
28
-
29
-
 30
30 -
 31
31 -
 32
32 -
 33
33 -
 34
34 -
 35
35 -
 36
36 -
 37
37 -
 38
38 -
 39
39 -
 40
40 -
 41
41 -
 42
42 -
 43
43 -
 44
44 -
 45
45 -
 46
46 -
 47
47 -
 48
48 -
 49
49 -
 50
50 -
51
-
52
-
53
-
54
-
55
-
56
-
57
-
58
-
59
-
60
-
61
-
62
-
63
-
64
 |
 |

38
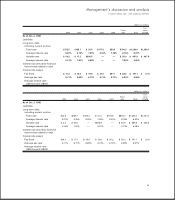
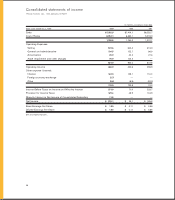
Consolidated statements of income
TYSON FOODS, INC. 1999 ANNUAL REPORT
in millions, except per share data
three years ended Oct. 2, 1999 1999 1998 1997
Sales $7,362.9 $7,414.1 $6,355.7
Cost of Sales 6,054.1 6,260.1 5,318.0
1,308.8 1,154.0 1,037.7
Operating Expenses:
Selling 574.6 642.2 513.3
General and administrative 134.5 132.7 96.9
Amortization 35.9 33.3 27.6
Asset impairment and other charges 76.9 142.2 —
821.9 950.4 637.8
Operating Income 486.9 203.6 399.9
Other expense (income):
Interest 124.0 139.1 110.4
Foreign currency exchange (2.7) — —
Other (5.4) (6.5) (40.2)
115.9 132.6 70.2
Income Before Taxes on Income and Minority Interest 371.0 71.0 329.7
Provision for Income Taxes 129.4 45.9 143.9
Minority Interest in Net Income of Consolidated Subsidiary 11.5 — —
Net Income $÷«230.1 $«««««25.1 $÷«185.8
Basic Earnings Per Share $÷÷«1.00 $÷÷«0.11 $÷÷«0.86
Diluted Earnings Per Share $÷÷«1.00 $÷÷«0.11 $÷÷«0.85
See accompanying notes.