Tyson Foods 1999 Annual Report Download - page 2
Download and view the complete annual report
Please find page 2 of the 1999 Tyson Foods annual report below. You can navigate through the pages in the report by either clicking on the pages listed below, or by using the keyword search tool below to find specific information within the annual report.-
 1
1 -
 2
2 -
 3
3 -
 4
4 -
 5
5 -
 6
6 -
 7
7 -
 8
8 -
 9
9 -
 10
10 -
 11
11 -
 12
12 -
 13
13 -
14
-
15
-
16
-
17
-
18
-
19
-
20
-
21
-
22
-
23
-
24
-
25
-
26
-
27
-
28
-
29
-
30
-
31
-
32
-
33
-
34
-
35
-
36
-
37
-
38
-
39
-
40
-
41
-
42
-
43
-
44
-
45
-
46
-
47
-
48
-
49
-
50
-
51
-
52
-
53
-
54
-
55
-
56
-
57
-
58
-
59
-
60
-
61
-
62
-
63
-
64
 |
 |

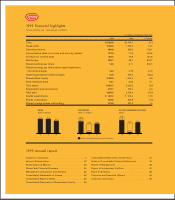
in millions, except per share data
1999 1998 % Change
Sales $7,362.9 $7,414.1 (0.7)
Gross profit 1,308.8 1,154.0 13.4
Operating income 486.9 203.6 139.1
Income before taxes on income and minority interest 371.0 71.0 422.5
Provision for income taxes 129.4 45.9 181.9
Net income 230.1 25.1 816.7
Diluted earnings per share 1.00 0.11 809.1
Diluted earnings per share before asset impairment
and other charges 1.20 0.79 51.9
Asset impairment and other charges 76.9 214.6 (64.2)
Shareholders’ equity 2,128.0 1,970.4 8.0
Book value per share 9.31 8.53 9.1
Total assets 5,082.7 5,242.5 (3.0)
Depreciation and amortization 291.1 276.4 5.3
Total debt 1,803.8 2,128.9 (15.3)
Capital expenditures $«««363.3 $«««310.4 17.0
Shares outstanding 228.6 230.9 (1.0)
Diluted average shares outstanding 231.0 227.9 1.4
1999 financial highlights
TYSON FOODS, INC. 1999 ANNUAL REPORT
Answers to Questions ................................2
Letter to Shareholders ...............................16
Business Group Reports .............................20
Eleven-Year Financial Summary.......................24
Management’s Discussion and Analysis ...............26
Consolidated Statements of Income ...................38
Consolidated Balance Sheets .........................39
Consolidated Statements of Shareholders’ Equity........40
Consolidated Statements of Cash Flows ...............41
Notes to Consolidated Financial Statements............42
Report of Management ..............................56
Report of Independent Auditors.......................57
Board of Directors...................................58
Corporate and Executive Officers .....................59
Corporate Information ...............................60
1999 annual report
SALES
dollars in billions
Before asset impairment and other charges
NET INCOME
dollars in millions
DILUTED EARNINGS PER SHARE
dollars
‘99 ‘98 ‘97
7.4 7.4
6.4
‘99 ‘98 ‘97
276.8
230.1
179.9
25.1
185.8
‘99 ‘98 ‘97
1.00
1.20
0.79
0.11
0.85