Toyota 2013 Annual Report Download - page 99
Download and view the complete annual report
Please find page 99 of the 2013 Toyota annual report below. You can navigate through the pages in the report by either clicking on the pages listed below, or by using the keyword search tool below to find specific information within the annual report.-
 1
1 -
2
-
3
-
4
-
5
-
6
-
7
-
8
-
9
-
10
-
11
-
12
-
13
-
14
-
15
-
16
-
17
-
18
-
19
-
20
-
21
-
22
-
23
-
24
-
25
-
26
-
27
-
28
-
29
-
30
-
31
-
32
-
33
-
34
-
35
-
36
-
37
-
38
-
39
-
40
-
41
-
42
-
43
-
44
-
45
-
46
-
47
-
48
-
49
-
50
-
51
-
52
-
53
-
54
-
55
-
56
-
57
-
58
-
59
-
60
-
61
-
62
-
63
-
64
-
65
-
66
-
67
-
68
-
69
-
70
-
71
-
72
-
73
-
74
-
75
-
76
-
77
-
78
-
79
-
80
-
81
-
82
-
83
-
84
-
85
-
86
-
87
-
88
-
 89
89 -
 90
90 -
 91
91 -
 92
92 -
 93
93 -
 94
94 -
 95
95 -
 96
96 -
 97
97 -
 98
98 -
 99
99 -
 100
100 -
 101
101 -
 102
102 -
 103
103 -
 104
104 -
 105
105 -
 106
106 -
 107
107 -
 108
108 -
 109
109 -
110
-
111
-
112
-
113
-
114
-
115
-
116
-
117
-
118
-
119
-
120
-
121
-
122
-
123
-
124
 |
 |
Toyota Global Vision President’s Message Launching a New Structure Special Feature Review of Operations
Consolidated Performance
Highlights
Management and
Corporate Information Investor InformationFinancial Section
Page 99
NextPrev
ContentsSearchPrint
ANNUAL REPORT 2013
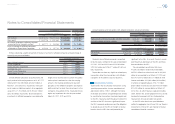
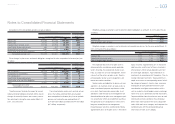
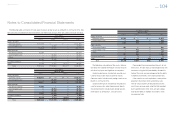
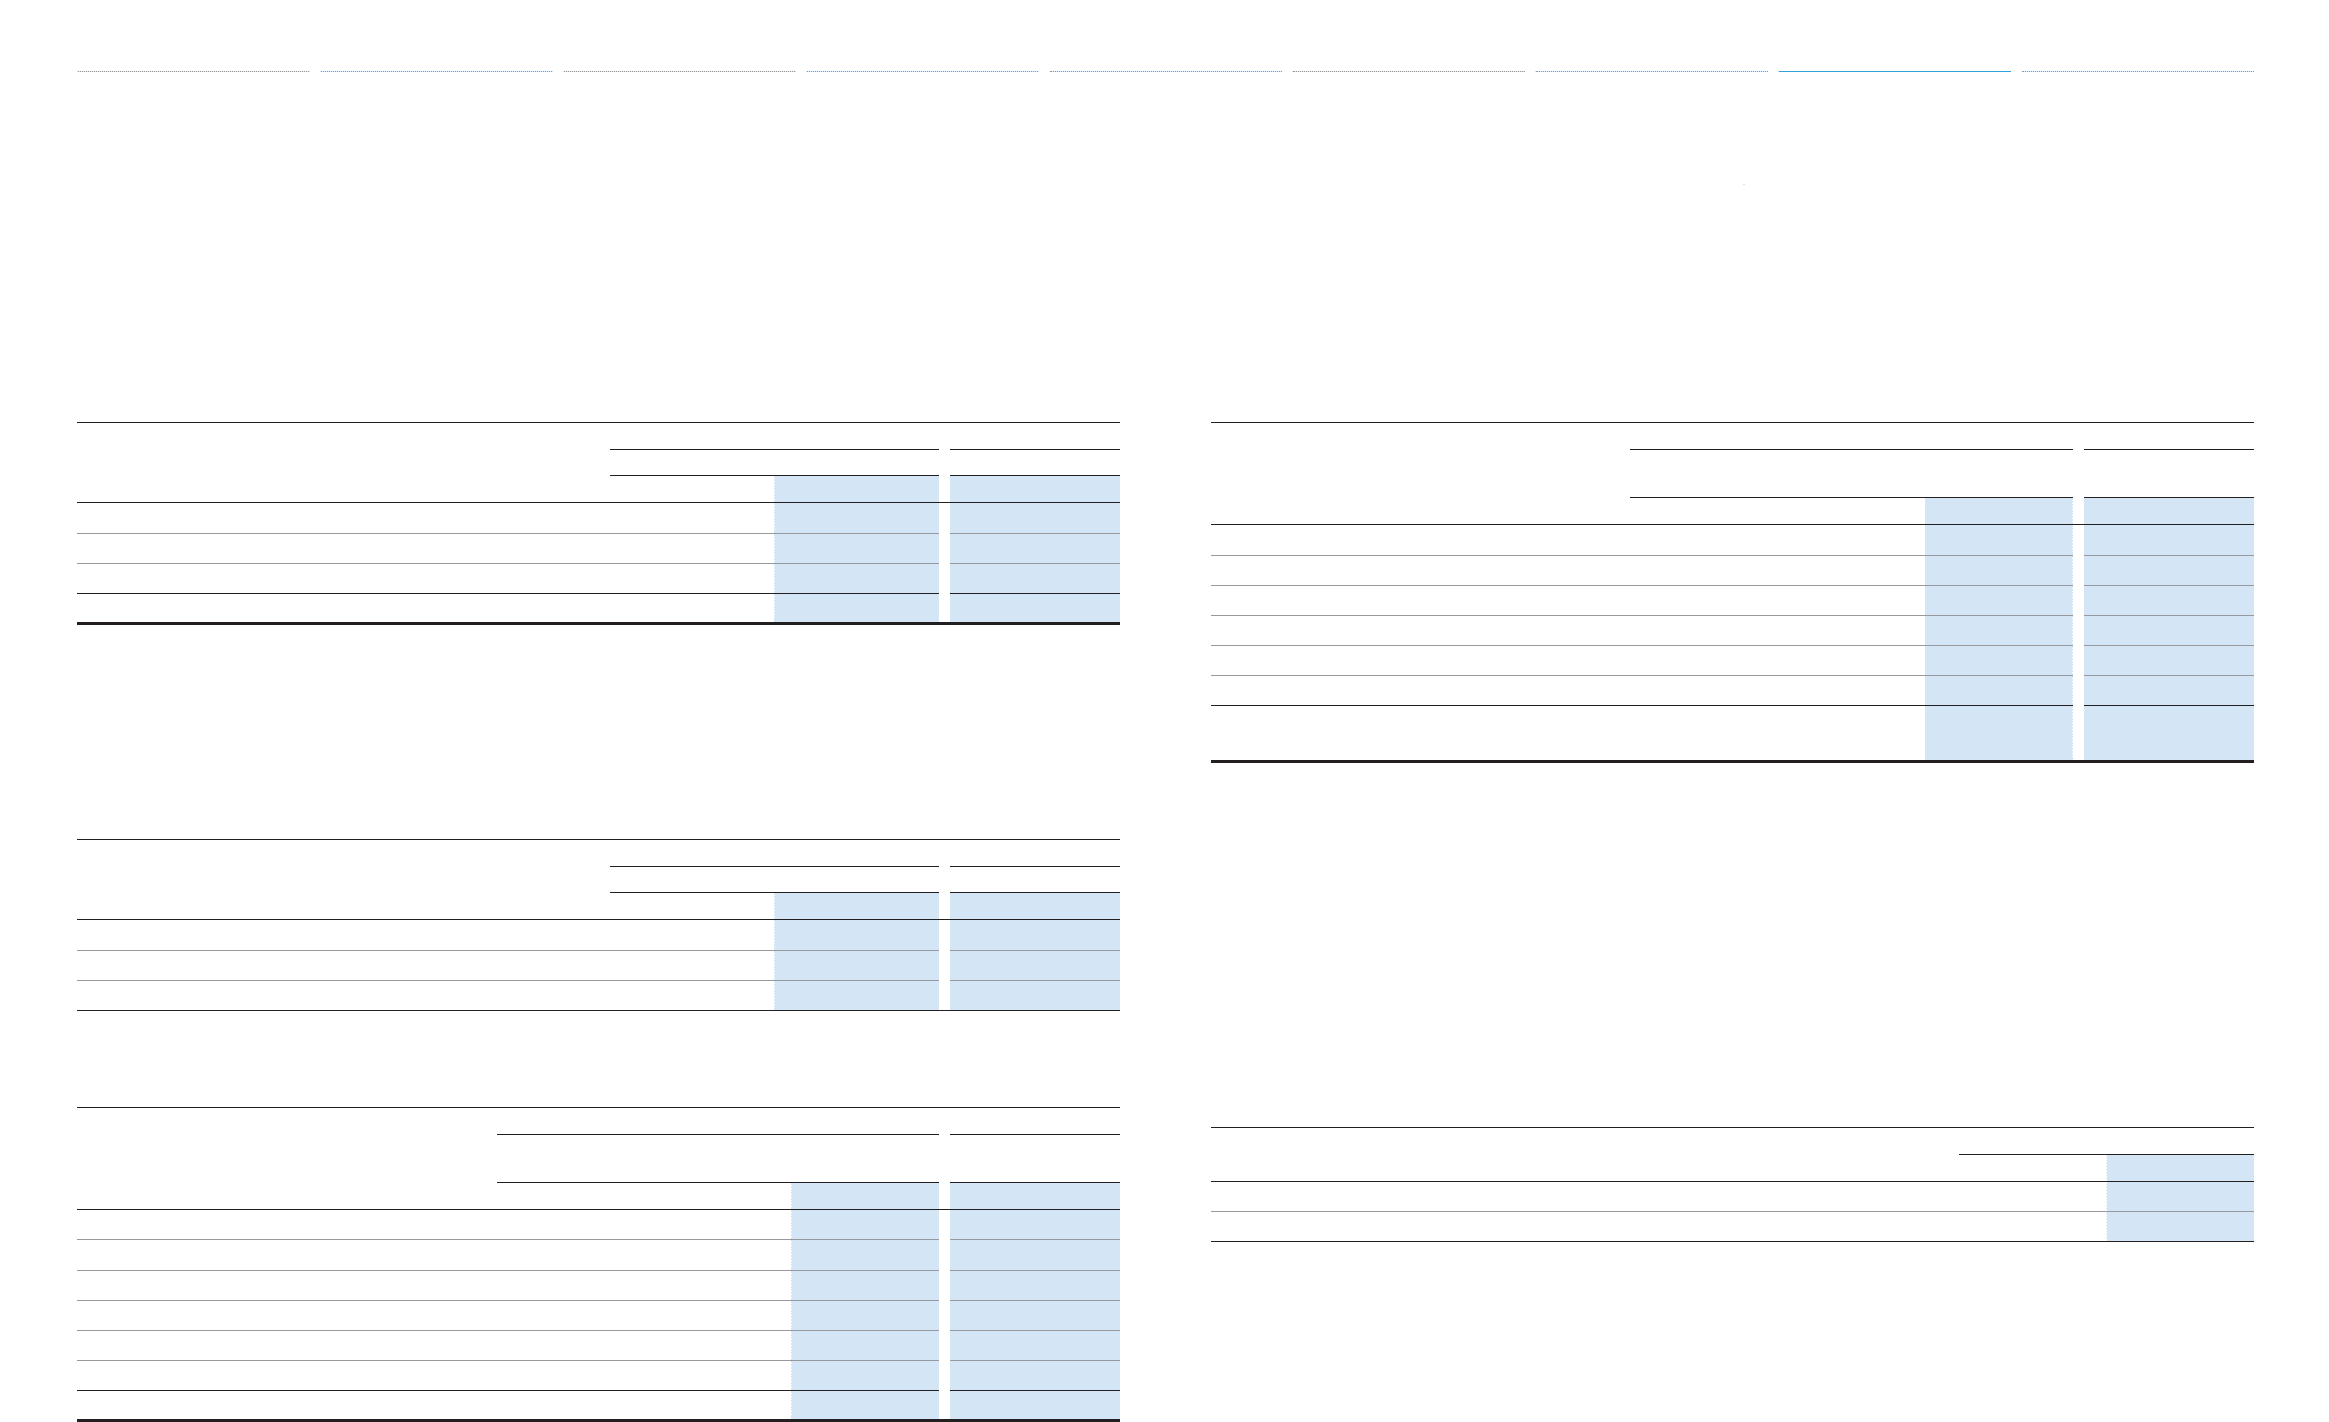
Amounts recognized in accumulated other comprehensive income (loss) as of March 31, 2012 and 2013
are comprised of the following:
Yen in millions U.S. dollars in millions
March 31, March 31,
2012 2013 2013
Net actuarial loss ¥(381,770) ¥(333,203) $(3,543)
Prior service costs 57,930 53,360 567
Net transition obligation — ——
Net amount recognized ¥(323,840) ¥(279,843) $(2,976)
The accumulated benefi t obligation for all defi ned benefi t pension plans was ¥1,379,373 million and
¥1,494,011 million ($15,885 million) at March 31, 2012 and 2013, respectively.
The projected benefi t obligation, accumulated benefi t obligation and fair value of plan assets for which the
accumulated benefi t obligations exceed plan assets are as follows:
Yen in millions U.S. dollars in millions
March 31, March 31,
2012 2013 2013
Projected benefi t obligation ¥728,469 ¥749,561 $7,970
Accumulated benefi t obligation 639,196 685,763 7,291
Fair value of plan assets 153,945 165,262 1,757
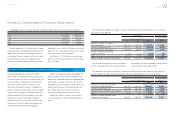
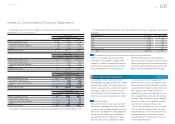
Components of the net periodic pension cost are as follows:
Yen in millions U.S. dollars in millions
For the years ended March 31,
For the year ended
March 31,
2011 2012 2013 2013
Service cost ¥61,134 ¥57,241 ¥60,261 $641
Interest cost 31,782 30,660 27,804 296
Expected return on plan assets (21,200) (21,558) (22,352) (238)
Amortization of prior service costs (24,421) (16,326) (8,033) (86)
Recognized net actuarial loss 15,029 28,342 16,619 177
Amortization of net transition obligation 1,944 1,626 ——
Net periodic pension cost ¥64,268 ¥79,985 ¥74,299 $790
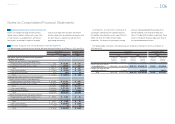
Other changes in plan assets and benefi t obligations recognized in other comprehensive income (loss) are
as follows:
Yen in millions U.S. dollars in millions
For the years ended March 31,
For the year ended
March 31,
2011 2012 2013 2013
Net actuarial gain (loss) ¥(15,734) ¥(87,163) ¥32,122 $341
Recognized net actuarial loss 15,029 28,342 16,619 177
Prior service costs 1,287 (632) 3,462 37
Amortization of prior service costs (24,421) (16,326) (8,033) (86)
Amortization of net transition obligation 1,944 1,626 ——
Other 10,529 63 (173) (2)
Total recognized in other
comprehensive income (loss) ¥(11,366) ¥(74,090) ¥43,997 $467
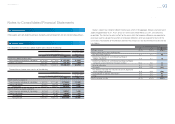
The other amount includes the impact of transi-
tion to defi ned contribution pension plans and con-
solidation and deconsolidation of certain entities
due to changes in ownership interest during the
years ended March 31, 2011, 2012 and 2013.
The estimated prior service costs and net actuarial
loss that will be amortized from accumulated other
comprehensive income (loss) into net periodic pen-
sion cost during the year ending March 31, 2014
are ¥(5,000) million ($(53) million) and ¥12,200 mil-
lion ($130 million), respectively.
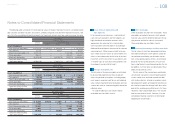
Weighted-average assumptions used to determine benefi t obligations as of March 31, 2012 and 2013 are
as follows:
March 31,
2012 2013
Discount rate 2.0% 1.7%
Rate of compensation increase 2.3% 2.2%
As of March 31, 2012 and 2013, the parent com-
pany and certain subsidiaries in Japan employ
“point” based retirement benefi t plans and do not
use the rates of compensation increase to deter-
mine benefi t obligations.
Notes to Consolidated Financial Statements
Selected Financial Summary (U.S. GAAP) Consolidated Segment Information Consolidated Quarterly Financial Summary Management’s Discussion and Analysis of Financial Condition and Results of Operations Consolidated Financial Statements Notes to Consolidated Financial Statements [22 of 44]
Management’s Annual Report on Internal Control over Financial Reporting Report of Independent Registered Public Accounting Firm