Toyota 2013 Annual Report Download - page 55
Download and view the complete annual report
Please find page 55 of the 2013 Toyota annual report below. You can navigate through the pages in the report by either clicking on the pages listed below, or by using the keyword search tool below to find specific information within the annual report.-
 1
1 -
2
-
3
-
4
-
5
-
6
-
7
-
8
-
9
-
10
-
11
-
12
-
13
-
14
-
15
-
16
-
17
-
18
-
19
-
20
-
21
-
22
-
23
-
24
-
25
-
26
-
27
-
28
-
29
-
30
-
31
-
32
-
33
-
34
-
35
-
36
-
37
-
38
-
39
-
40
-
41
-
42
-
43
-
44
-
 45
45 -
 46
46 -
 47
47 -
 48
48 -
 49
49 -
 50
50 -
 51
51 -
 52
52 -
 53
53 -
 54
54 -
 55
55 -
 56
56 -
 57
57 -
 58
58 -
 59
59 -
 60
60 -
 61
61 -
 62
62 -
 63
63 -
 64
64 -
 65
65 -
66
-
67
-
68
-
69
-
70
-
71
-
72
-
73
-
74
-
75
-
76
-
77
-
78
-
79
-
80
-
81
-
82
-
83
-
84
-
85
-
86
-
87
-
88
-
89
-
90
-
91
-
92
-
93
-
94
-
95
-
96
-
97
-
98
-
99
-
100
-
101
-
102
-
103
-
104
-
105
-
106
-
107
-
108
-
109
-
110
-
111
-
112
-
113
-
114
-
115
-
116
-
117
-
118
-
119
-
120
-
121
-
122
-
123
-
124
 |
 |
Toyota Global Vision President’s Message Launching a New Structure Special Feature Review of Operations
Consolidated Performance
Highlights
Management and
Corporate Information Investor InformationFinancial Section
Page 55
NextPrev
ContentsSearchPrint
ANNUAL REPORT 2013
Other Income and Expenses
Interest and dividend income decreased by ¥1.1 bil-
lion, or 1.2%, to ¥98.6 billion during fi scal 2013
compared with the prior fi scal year.
Interest expense was ¥22.9 billion during fi scal
2013, on the same level as that of the prior
fi scal year.
Foreign exchange gain, net decreased by ¥31.5
billion, or 85.0%, to ¥5.5 billion during fi scal 2013
compared with the prior fi scal year. Foreign
exchange gains and losses include the differences
between the value of foreign currency denominated
assets and liabilities recognized through transac-
tions in foreign currencies translated at prevailing
exchange rates and the value at the date the trans-
action settled during the fi scal year, including those
settled using forward foreign currency exchange
contracts, or the value translated by appropriate
year-end current exchange rates. The ¥31.5 billion
decrease in foreign exchange gain, net was due
mainly to the losses resulting from the Japanese
yen being stronger against foreign currencies at the
time foreign currency bonds were redeemed during
fi scal 2013 than those at the time of purchase.
Other loss, net increased by ¥38.3 billion to ¥1.5
billion during fi scal 2013 compared with the prior
fi scal year.
Income Taxes
The provision for income taxes increased by ¥289.4
billion, or 110.3%, to ¥551.6 billion during fi scal
2013 compared with the prior fi scal year due to the
increase in income before income taxes. The
with the prior fi scal year. This increase resulted from
favorable foreign currency translation adjustments
gains of ¥434.6 billion in fi scal 2013 compared with
losses of ¥87.7 billion in the prior fi scal year, and
from unrealized holding gains on securities in fi scal
2013 of ¥368.5 billion compared with gains of
¥129.3 billion in the prior fi scal year. The increase in
unrealized holding gains on securities was due
mainly to changes in stock prices.
effective tax rate for fi scal 2013 was 39.3%, which
was higher than the statutory tax rate in Japan. This
was due mainly to deferred tax liabilities relating to
undistributed earnings in affi liated companies
accounted for by the equity method.
Net Income and Loss Attributable to
Noncontrolling Interests and Equity in
Earnings of Affi liated Companies
Net income attributable to noncontrolling interests
increased by ¥36.5 billion, or 43.2%, to ¥121.3 bil-
lion during fi
scal 2013 compared with the prior fi scal
year. This increase was due mainly to an increase
during fi scal 2013 in net income attributable to the
shareholders of consolidated subsidiaries.
Equity in earnings of affi liated companies during
fi scal 2013 increased by ¥33.8 billion, or 17.1%, to
¥231.5 billion compared with the prior fi scal year.
This increase was due mainly to an increase during
fi scal 2013 in net income attributable to the share-
holders of affi liated companies accounted for by the
equity method.
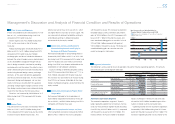
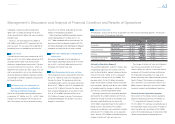
Net Income Attributable to Toyota Motor
Corporation
Net income attributable to the shareholders of
Toyota Motor Corporation increased by ¥678.6 bil-
lion, or 239.3%, to ¥962.1 billion during fi scal 2013
compared with the prior fi scal year.
Other Comprehensive Income and Loss
Other comprehensive income increased by ¥856.8
billion to ¥822.7 billion for fi scal 2013 compared
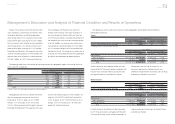
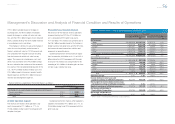
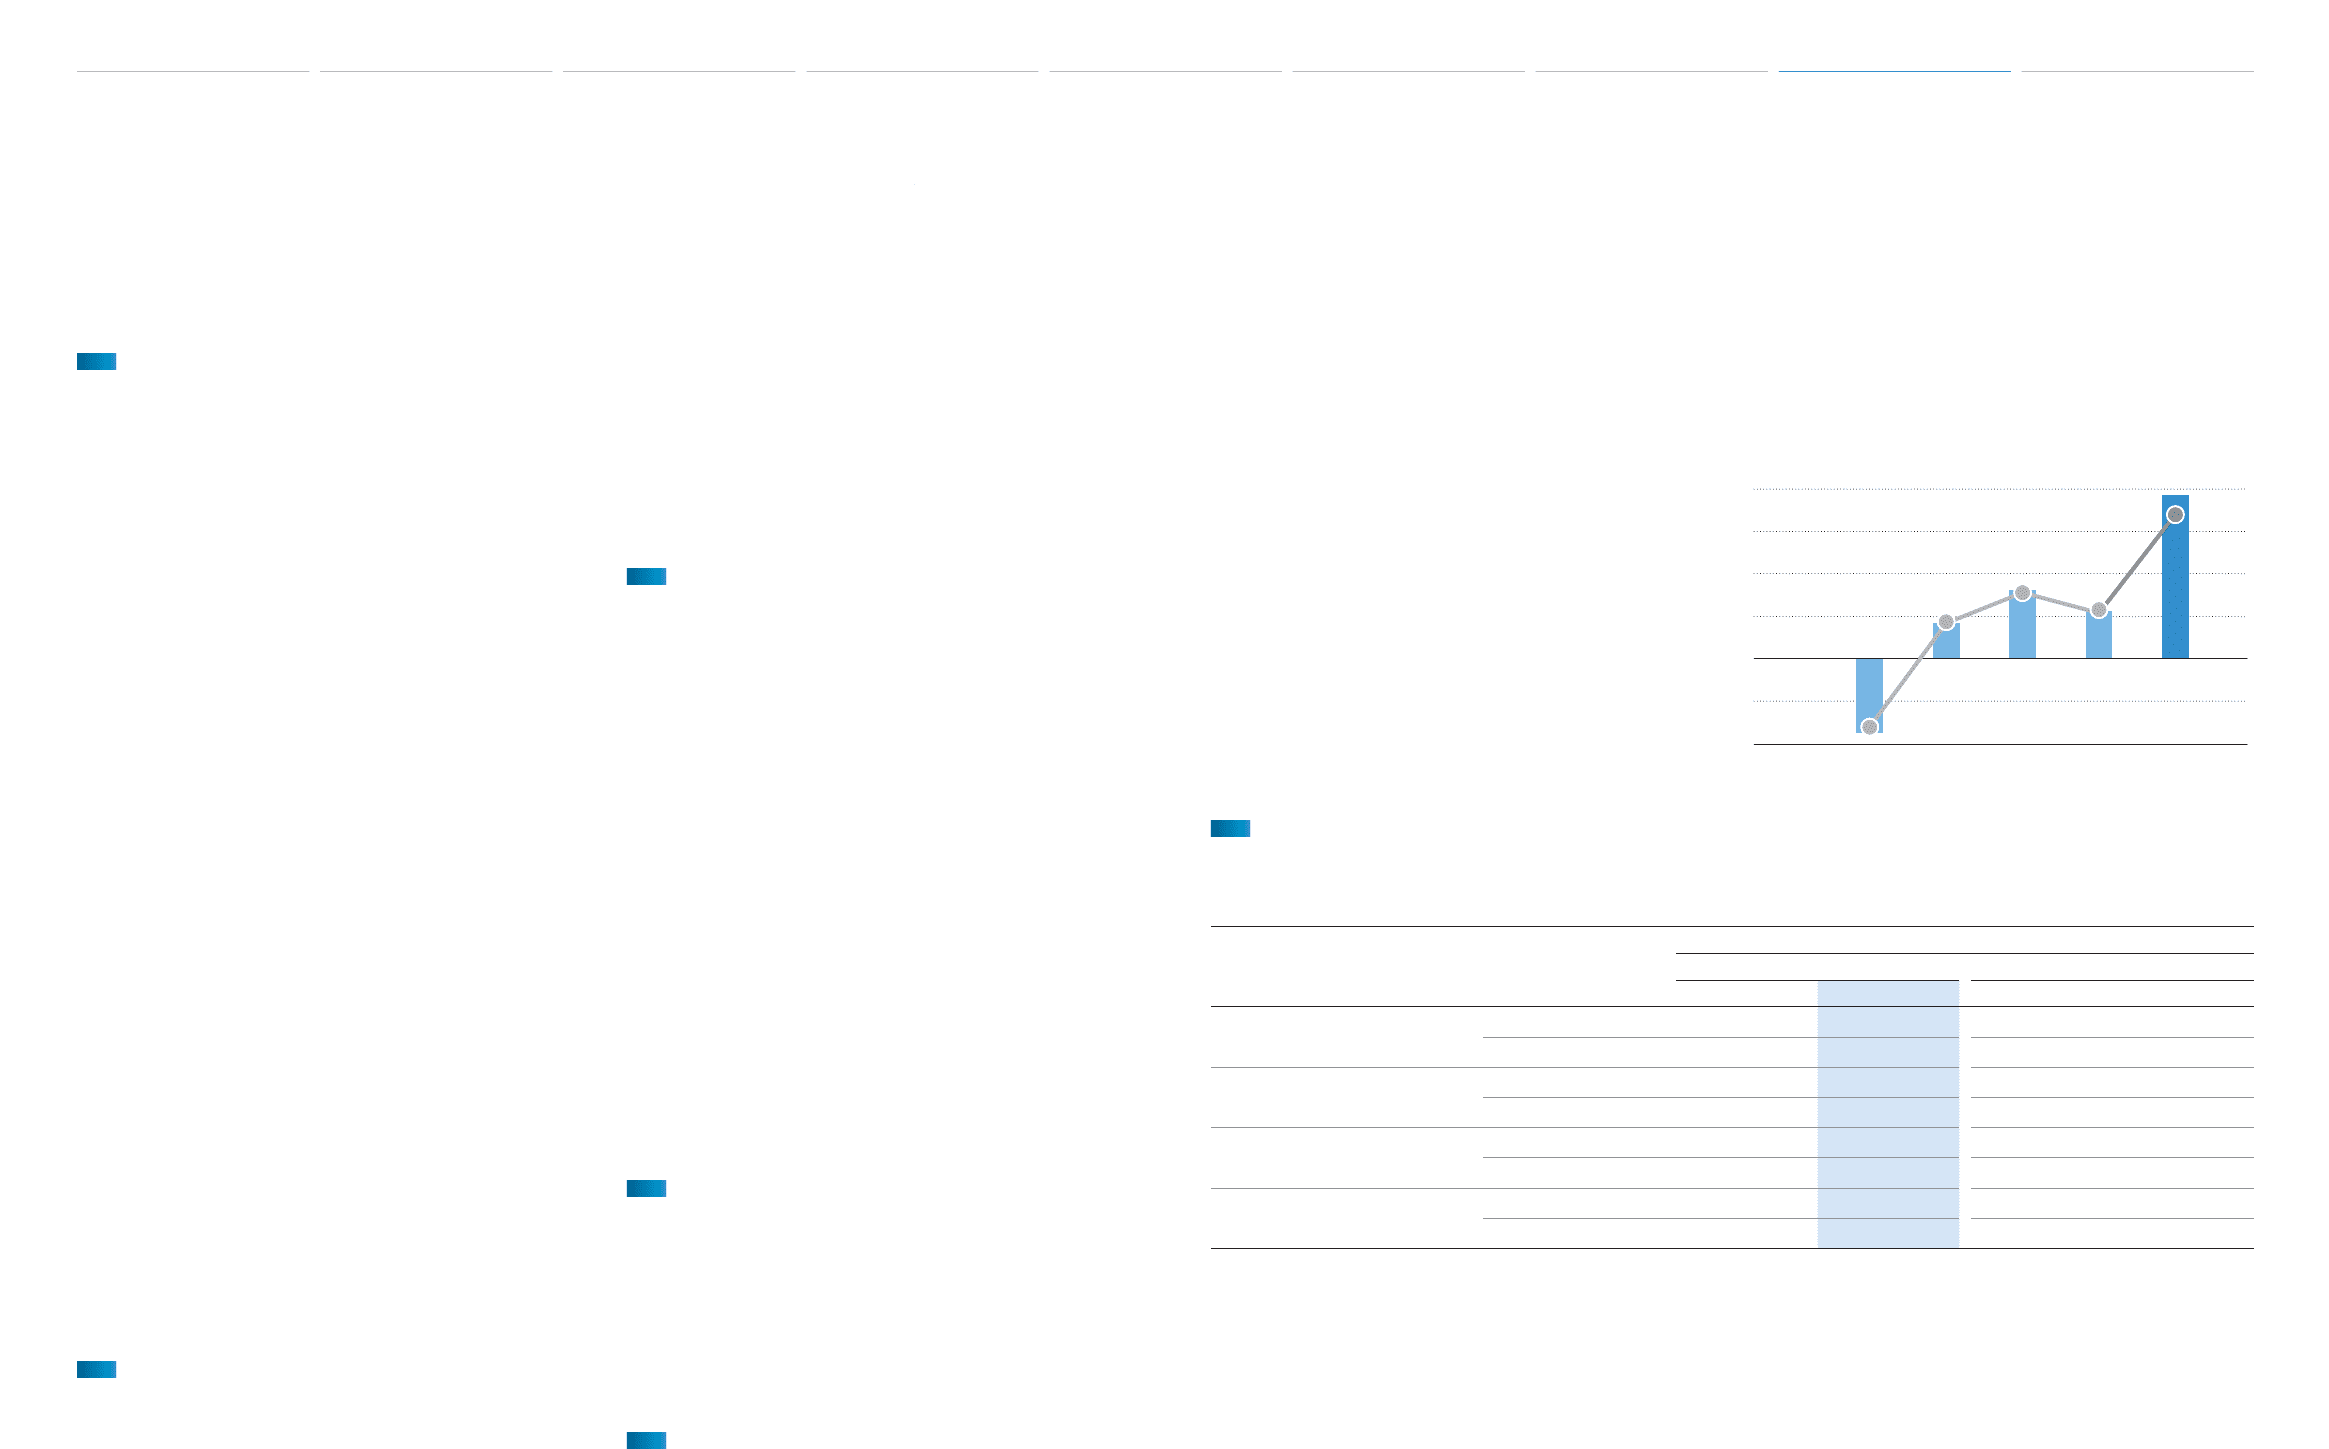
Segment Information
The following is a discussion of results of operations for each of Toyota’s operating segments. The amounts
presented are prior to intersegment elimination.
Yen in millions
Years ended March 31, 2013 vs. 2012 Change
2012 2013 Amount Percentage (%)
Automotive: Net revenues ¥16,994,546 ¥20,419,100 ¥3,424,554 +20.2
Operating income 21,683 944,704 923,021 +4,256.9
Financial Services: Net revenues 1,100,324 1,170,670 70,346 +6.4
Operating income 306,438 315,820 9,382 +3.1
All Other: Net revenues 1,048,915 1,066,461 17,546 +1.7
Operating income 42,062 53,616 11,554 +27.5
Intersegment elimination/
unallocated amount:
Net revenues (560,132) (592,039) (31,907) —
Operating income (14,556) 6,748 21,304 —
Automotive Operations Segment
The automotive operations segment is Toyota’s
largest operating segment by net revenues. Net rev-
enues for the automotive segment increased during
fi scal 2013 by ¥3,424.5 billion, or 20.2%, compared
with the prior fi scal year to ¥20,419.1 billion. The
increase refl ects the ¥3,030.0 billion of favorable
impact of changes in vehicle unit sales and sales
mix and the ¥245.4 billion favorable impact of fl uc-
tuations in foreign currency translation rates.
Operating income from the automotive operations
increased by ¥923.0 billion during fi scal 2013 com-
pared with the prior fi scal year to ¥944.7 billion. This
increase in operating income was due mainly to the
1,000
-500
10.0
500 5.0
750 7.5
250 2.5
-250 -2.5
-5.0
00
Net Income (Loss) Attributable to
Toyota Motor Corporation and ROE
왎왎 Net income (loss) attributable to Toyota Motor Corporation
쎲쎲 ROE (Right scale)
(¥ Billion)
FY
(%)
’09 ’10 ’11 ’12 ’13
Management’s Discussion and Analysis of Financial Condition and Results of Operations
Selected Financial Summary (U.S. GAAP) Consolidated Segment Information Consolidated Quarterly Financial Summary Management’s Discussion and Analysis of Financial Condition and Results of Operations [10 of 26] Consolidated Financial Statements Notes to Consolidated Financial Statements
Management’s Annual Report on Internal Control over Financial Reporting Report of Independent Registered Public Accounting Firm