Toyota 2013 Annual Report Download - page 104
Download and view the complete annual report
Please find page 104 of the 2013 Toyota annual report below. You can navigate through the pages in the report by either clicking on the pages listed below, or by using the keyword search tool below to find specific information within the annual report.-
 1
1 -
2
-
3
-
4
-
5
-
6
-
7
-
8
-
9
-
10
-
11
-
12
-
13
-
14
-
15
-
16
-
17
-
18
-
19
-
20
-
21
-
22
-
23
-
24
-
25
-
26
-
27
-
28
-
29
-
30
-
31
-
32
-
33
-
34
-
35
-
36
-
37
-
38
-
39
-
40
-
41
-
42
-
43
-
44
-
45
-
46
-
47
-
48
-
49
-
50
-
51
-
52
-
53
-
54
-
55
-
56
-
57
-
58
-
59
-
60
-
61
-
62
-
63
-
64
-
65
-
66
-
67
-
68
-
69
-
70
-
71
-
72
-
73
-
74
-
75
-
76
-
77
-
78
-
79
-
80
-
81
-
82
-
83
-
84
-
85
-
86
-
87
-
88
-
89
-
90
-
91
-
92
-
93
-
 94
94 -
 95
95 -
 96
96 -
 97
97 -
 98
98 -
 99
99 -
 100
100 -
 101
101 -
 102
102 -
 103
103 -
 104
104 -
 105
105 -
 106
106 -
 107
107 -
 108
108 -
 109
109 -
 110
110 -
 111
111 -
 112
112 -
 113
113 -
 114
114 -
115
-
116
-
117
-
118
-
119
-
120
-
121
-
122
-
123
-
124
 |
 |

Toyota Global Vision President’s Message Launching a New Structure Special Feature Review of Operations
Consolidated Performance
Highlights
Management and
Corporate Information Investor InformationFinancial Section
Page 104
NextPrev
ContentsSearchPrint
ANNUAL REPORT 2013
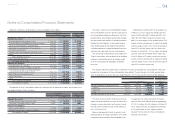
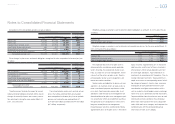
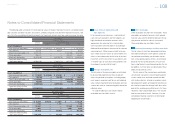
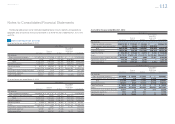
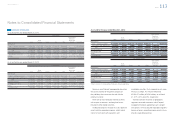
The following table summarizes the fair value of classes of plan assets as of March 31, 2012 and 2013. See
note 26 to the consolidated fi nancial statements for three levels of input which are used to measure fair value.
Yen in millions
March 31, 2012
Level 1 Level 2 Level 3 Total
Equity securities
Common stocks ¥114,955 ¥ — ¥ — ¥114,955
Commingled funds — 74,815 — 74,815
114,955 74,815 — 189,770
Debt securities
Government bonds 25,084 — — 25,084
Commingled funds — 43,062 — 43,062
Other — 29,278 — 29,278
25,084 72,340 — 97,424
Insurance contracts — — — —
Other 21,184 3,471 31,377 56,032
Total ¥161,223 ¥150,626 ¥31,377 ¥343,226
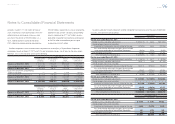
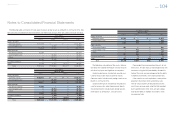
Yen in millions
March 31, 2013
Level 1 Level 2 Level 3 Total
Equity securities
Common stocks ¥183,611 ¥ — ¥ — ¥183,611
Commingled funds — 86,539 — 86,539
183,611 86,539 — 270,150
Debt securities
Government bonds 47,083 — — 47,083
Commingled funds — 42,754 — 42,754
Other — 40,486 — 40,486
47,083 83,240 — 130,323
Insurance contracts — 1,202 — 1,202
Other 30,739 6,218 40,607 77,564
Total ¥261,433 ¥177,199 ¥40,607 ¥479,239
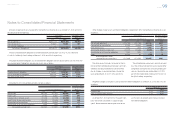
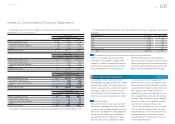
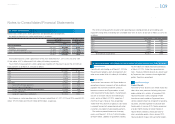
U.S. dollars in millions
March 31, 2013
Level 1 Level 2 Level 3 Total
Equity securities
Common stocks $1,952 $ — $ — $1,952
Commingled funds — 920 — 920
1,952 920 — 2,872
Debt securities
Government bonds 501 — — 501
Commingled funds — 455 — 455
Other — 430 — 430
501 885 — 1,386
Insurance contracts —13— 13
Other 327 66 432 825
Total $2,780 $1,884 $432 $5,096
The following is description of the assets, informa-
tion about the valuation techniques used to measure
fair value, key inputs and signifi cant assumptions:
Quoted market prices for identical securities are
used to measure fair value of common stocks.
Common stocks include mainly foreign stocks as of
March 31, 2012 and 2013.
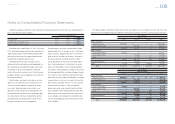
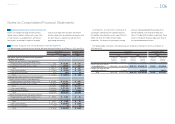
Quoted market prices for identical securities are
used to measure fair value of government bonds.
Government bonds include mainly foreign govern-
ment bonds as of March 31, 2012 and 2013.
Commingled funds are benefi cial interests of col-
lective trust. The fair values of commingled funds are
measured using the NAV provided by the adminis-
trator of the fund, and are categorized by the ability
to redeem investments at the measurement day.
Other consists of cash equivalents, other private
placement investment funds and other assets.
The fair values of other private placement invest-
ment funds are measured using the NAV provided
by the administrator of the fund, and are catego-
rized by the ability to redeem investments at the
measurement day.
Notes to Consolidated Financial Statements
Selected Financial Summary (U.S. GAAP) Consolidated Segment Information Consolidated Quarterly Financial Summary Management’s Discussion and Analysis of Financial Condition and Results of Operations Consolidated Financial Statements Notes to Consolidated Financial Statements [27 of 44]
Management’s Annual Report on Internal Control over Financial Reporting Report of Independent Registered Public Accounting Firm