Toyota 2013 Annual Report Download - page 116
Download and view the complete annual report
Please find page 116 of the 2013 Toyota annual report below. You can navigate through the pages in the report by either clicking on the pages listed below, or by using the keyword search tool below to find specific information within the annual report.-
 1
1 -
2
-
3
-
4
-
5
-
6
-
7
-
8
-
9
-
10
-
11
-
12
-
13
-
14
-
15
-
16
-
17
-
18
-
19
-
20
-
21
-
22
-
23
-
24
-
25
-
26
-
27
-
28
-
29
-
30
-
31
-
32
-
33
-
34
-
35
-
36
-
37
-
38
-
39
-
40
-
41
-
42
-
43
-
44
-
45
-
46
-
47
-
48
-
49
-
50
-
51
-
52
-
53
-
54
-
55
-
56
-
57
-
58
-
59
-
60
-
61
-
62
-
63
-
64
-
65
-
66
-
67
-
68
-
69
-
70
-
71
-
72
-
73
-
74
-
75
-
76
-
77
-
78
-
79
-
80
-
81
-
82
-
83
-
84
-
85
-
86
-
87
-
88
-
89
-
90
-
91
-
92
-
93
-
94
-
95
-
96
-
97
-
98
-
99
-
100
-
101
-
102
-
103
-
104
-
105
-
 106
106 -
 107
107 -
 108
108 -
 109
109 -
 110
110 -
 111
111 -
 112
112 -
 113
113 -
 114
114 -
 115
115 -
 116
116 -
 117
117 -
 118
118 -
 119
119 -
 120
120 -
 121
121 -
 122
122 -
 123
123 -
 124
124
 |
 |

Toyota Global Vision President’s Message Launching a New Structure Special Feature Review of Operations
Consolidated Performance
Highlights
Management and
Corporate Information Investor InformationFinancial Section
Page 116
NextPrev
ContentsSearchPrint
ANNUAL REPORT 2013
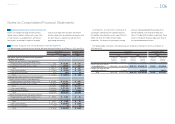
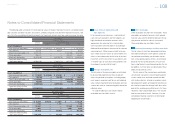
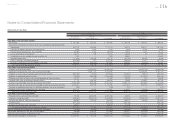
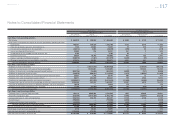
Statements of cash fl ows
Yen in millions Yen in millions
For the year ended March 31, 2011 For the year ended March 31, 2012
Non-Financial
Services Businesses
Financial
Services Businesses Consolidated
Non-Financial
Services Businesses
Financial Services
Businesses Consolidated
Cash fl ows from operating activities
Net income ¥ 241,448 ¥ 226,322 ¥ 465,485 ¥ 186,159 ¥ 182,191 ¥ 368,302
Adjustments to reconcile net income to net cash provided by operating activities
Depreciation 844,708 330,865 1,175,573 769,073 298,757 1,067,830
Provision for doubtful accounts and credit losses 1,806 2,334 4,140 5,843 3,780 9,623
Pension and severance costs, less payments (24,867) 1,453 (23,414) 15,410 1,301 16,711
Losses on disposal of fi xed assets 36,076 138 36,214 33,448 80 33,528
Unrealized losses on available-for-sale securities, net 7,915 — 7,915 53,831 — 53,831
Deferred income taxes (17,258) 103,035 85,710 (82,792) 89,199 6,395
Equity in earnings of affi liated companies (214,229) (787) (215,016) (196,544) (1,157) (197,701)
Changes in operating assets and liabilities, and other 591,378 (106,416) 487,402 182,931 (73,020) 93,916
Net cash provided by operating activities 1,466,977 556,944 2,024,009 967,359 501,131 1,452,435
Cash fl ows from investing activities
Additions to fi nance receivables — (14,323,261) (8,438,785) — (13,455,792) (8,333,248)
Collection of and proceeds from sales of fi nance receivables — 13,887,751 8,003,940 — 13,168,058 8,061,710
Additions to fi xed assets excluding equipment leased to others (621,302) (8,024) (629,326) (713,867) (9,670) (723,537)
Additions to equipment leased to others (78,559) (983,306) (1,061,865) (135,054) (673,491) (808,545)
Proceeds from sales of fi xed assets excluding equipment leased to others 50,742 600 51,342 36,203 430 36,633
Proceeds from sales of equipment leased to others 17,700 468,995 486,695 20,689 410,624 431,313
Purchases of marketable securities and security investments (4,063,499) (358,308) (4,421,807) (2,565,772) (607,862) (3,173,634)
Proceeds from sales of and maturity of marketable securities and security investments 3,423,618 292,538 3,716,156 2,227,812 629,013 2,856,825
Payment for additional investments in affi liated companies, net of cash acquired (299) — (299) (147) — (147)
Changes in investments and other assets, and other 394,479 18,303 177,605 213,957 (12,206) 209,972
Net cash used in investing activities (877,120) (1,004,712) (2,116,344) (916,179) (550,896) (1,442,658)
Cash fl ows from fi nancing activities
Proceeds from issuance of long-term debt 15,318 2,934,588 2,931,436 39,803 2,379,152 2,394,807
Payments of long-term debt (309,862) (2,306,139) (2,489,632) (294,646) (2,608,135) (2,867,572)
Increase (decrease) in short-term borrowings (86,884) 122,619 162,260 238,072 93,002 311,651
Dividends paid (141,120) — (141,120) (156,785) — (156,785)
Purchase of common stock, and other (28,617) — (28,617) (37,448) — (37,448)
Net cash provided by (used in) fi nancing activities (551,165) 751,068 434,327 (211,004) (135,981) (355,347)
Effect of exchange rate changes on cash and cash equivalents (76,960) (50,069) (127,029) (36,093) (19,846) (55,939)
Net increase (decrease) in cash and cash equivalents (38,268) 253,231 214,963 (195,917) (205,592) (401,509)
Cash and cash equivalents at beginning of year 1,338,821 526,925 1,865,746 1,300,553 780,156 2,080,709
Cash and cash equivalents at end of year ¥1,300,553 ¥ 780,156 ¥2,080,709 ¥1,104,636 ¥ 574,564 ¥1,679,200
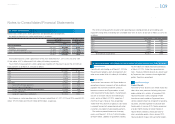
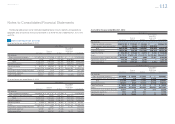
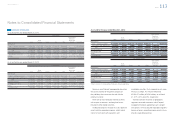
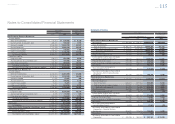
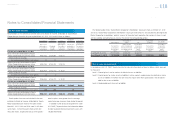
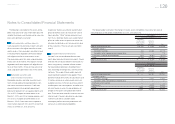
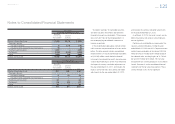
Notes to Consolidated Financial Statements
Selected Financial Summary (U.S. GAAP) Consolidated Segment Information Consolidated Quarterly Financial Summary Management’s Discussion and Analysis of Financial Condition and Results of Operations Consolidated Financial Statements Notes to Consolidated Financial Statements [39 of 44]
Management’s Annual Report on Internal Control over Financial Reporting Report of Independent Registered Public Accounting Firm