Toyota 2013 Annual Report Download - page 94
Download and view the complete annual report
Please find page 94 of the 2013 Toyota annual report below. You can navigate through the pages in the report by either clicking on the pages listed below, or by using the keyword search tool below to find specific information within the annual report.-
 1
1 -
2
-
3
-
4
-
5
-
6
-
7
-
8
-
9
-
10
-
11
-
12
-
13
-
14
-
15
-
16
-
17
-
18
-
19
-
20
-
21
-
22
-
23
-
24
-
25
-
26
-
27
-
28
-
29
-
30
-
31
-
32
-
33
-
34
-
35
-
36
-
37
-
38
-
39
-
40
-
41
-
42
-
43
-
44
-
45
-
46
-
47
-
48
-
49
-
50
-
51
-
52
-
53
-
54
-
55
-
56
-
57
-
58
-
59
-
60
-
61
-
62
-
63
-
64
-
65
-
66
-
67
-
68
-
69
-
70
-
71
-
72
-
73
-
74
-
75
-
76
-
77
-
78
-
79
-
80
-
81
-
82
-
83
-
 84
84 -
 85
85 -
 86
86 -
 87
87 -
 88
88 -
 89
89 -
 90
90 -
 91
91 -
 92
92 -
 93
93 -
 94
94 -
 95
95 -
 96
96 -
 97
97 -
 98
98 -
 99
99 -
 100
100 -
 101
101 -
 102
102 -
 103
103 -
 104
104 -
105
-
106
-
107
-
108
-
109
-
110
-
111
-
112
-
113
-
114
-
115
-
116
-
117
-
118
-
119
-
120
-
121
-
122
-
123
-
124
 |
 |
Toyota Global Vision President’s Message Launching a New Structure Special Feature Review of Operations
Consolidated Performance
Highlights
Management and
Corporate Information Investor InformationFinancial Section
Page 94
NextPrev
ContentsSearchPrint
ANNUAL REPORT 2013
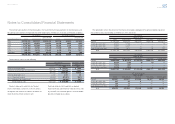
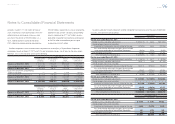
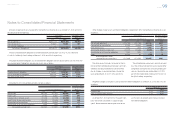
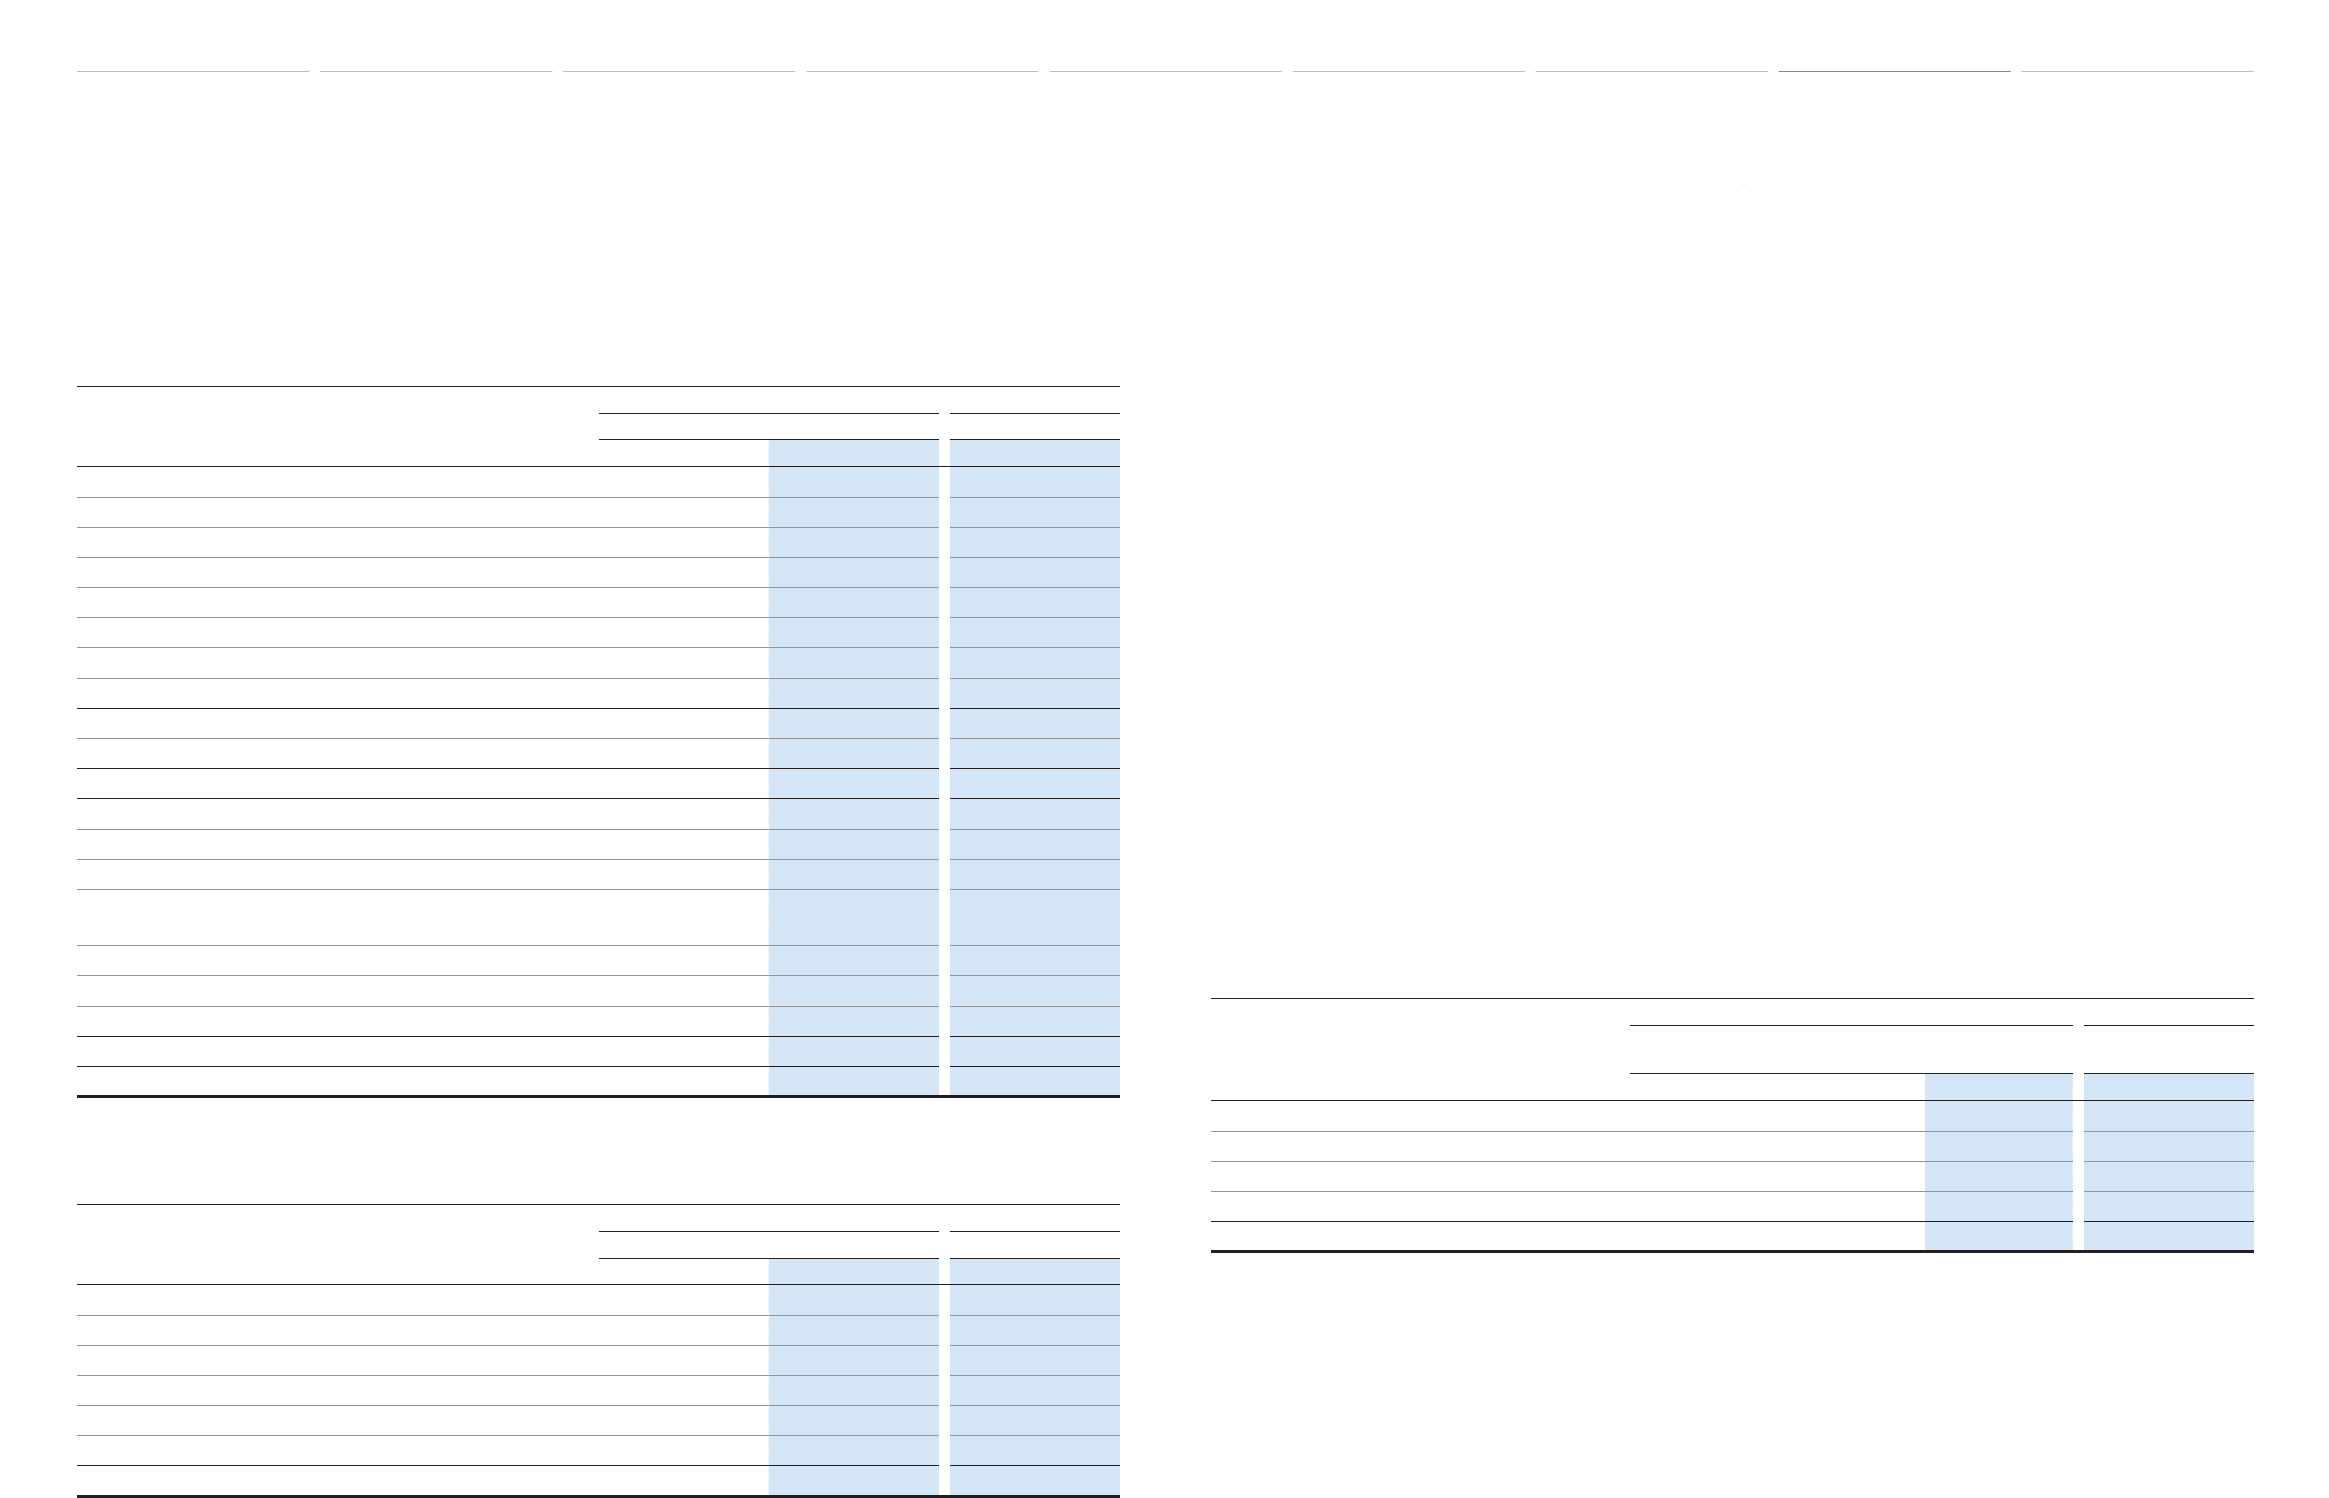
Signifi cant components of deferred tax assets and liabilities are as follows:
Yen in millions U.S. dollars in millions
March 31, March 31,
2012 2013 2013
Deferred tax assets:
Accrued pension and severance costs ¥ 236,978 ¥ 230,021 $ 2,446
Accrued expenses and liabilities for quality assurances 369,985 480,428 5,108
Other accrued employees’ compensation 106,265 108,599 1,155
Operating loss carryforwards for tax purposes 337,992 160,936 1,711
Tax credit carryforwards 108,426 101,251 1,076
Property, plant and equipment and other assets 147,906 151,043 1,606
Other 296,934 227,596 2,420
Gross deferred tax assets 1,604,486 1,459,874 15,522
Less—Valuation allowance (309,268) (284,835) (3,028)
Total deferred tax assets 1,295,218 1,175,039 12,494
Deferred tax liabilities:
Unrealized gains on securities (210,475) (388,901) (4,135)
Undistributed earnings of foreign subsidiaries (27,581) (25,713) (274)
Undistributed earnings of affi liated companies
accounted for by the equity method (504,776) (567,054) (6,029)
Basis difference of acquired assets (34,120) (35,647) (379)
Lease transactions (576,809) (650,389) (6,915)
Other (54,749) (66,923) (712)
Gross deferred tax liabilities (1,408,510) (1,734,627) (18,444)
Net deferred tax liability ¥ (113,292) ¥ (559,588) $ (5,950)
The deferred tax assets and liabilities above that comprise the net deferred tax liability are included in the
consolidated balance sheets as follows:
Yen in millions U.S. dollars in millions
March 31, March 31,
2012 2013 2013
Deferred tax assets:
Deferred income taxes (Current assets) ¥ 718,687 ¥ 749,398 $ 7,968
Investments and other assets—Other 91,857 100,199 1,065
Deferred tax liabilities:
Other current liabilities (14,953) (23,258) (247)
Deferred income taxes (Long-term liabilities) (908,883) (1,385,927) (14,736)
Net deferred tax liability ¥(113,292) ¥ (559,588) $ (5,950)
The factors used to assess the likelihood of realiza-
tion of the deferred tax assets are the future reversal
of existing taxable temporary differences, the future
taxable income and available tax planning strategies
that are prudent and feasible. All available evidence,
both positive and negative, is considered to deter-
mine whether, based on the weight of that evidence,
a valuation allowance is needed for deferred tax assets
which are not more-likely-than-not to be realized.
The accounting for deferred tax assets represents
Toyota’s current best estimate based on all available
evidence. Unanticipated events or changes could
result in re-evaluating the realizability of deferred
tax assets.
Operating loss carryforwards for tax purposes as
of March 31, 2013 in Japan and foreign countries
were ¥76,280 million ($811 million) and ¥422,133
million ($4,488 million), respectively, and are avail-
able as an offset against future taxable income. The
majority of these carryforwards in Japan and foreign
countries expire in years 2014 to 2022 and expire in
years 2014 to 2033, respectively. Tax credit carry-
forwards as of March 31, 2013 in Japan and foreign
countries were ¥90,439 million ($961 million) and
¥10,812 million ($115 million), respectively, and the
majority of these carryforwards in Japan and foreign
countries expire in years 2014 to 2016 and expire in
years 2014 to 2033, respectively.
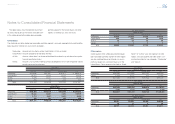
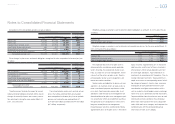
The valuation allowance mainly relates to deferred tax assets of operating loss and foreign tax credit carry-
forwards for tax purposes that are not expected to be realized. The net changes in the total valuation allow-
ance for deferred tax assets for the years ended March 31, 2011, 2012 and 2013 consist of the following:
Yen in millions U.S. dollars in millions
For the years ended March 31,
For the year ended
March 31,
2011 2012 2013 2013
Valuation allowance at beginning of year ¥239,269 ¥280,685 ¥309,268 $3,288
Additions 55,791 96,754 38,285 407
Deductions (10,077) (65,566) (70,986) (755)
Other (4,298) (2,605) 8,268 88
Valuation allowance at end of year ¥280,685 ¥309,268 ¥284,835 $3,028
The other amount includes the impact of consoli-
dation and deconsolidation of certain entities due to
changes in ownership interest and currency transla-
tion adjustments during the years ended March 31,
2011, 2012 and 2013.
Because management intends to reinvest undis-
tributed earnings of foreign subsidiaries to the extent
not expected to be remitted in the foreseeable future,
management has made no provision for income
taxes on those undistributed earnings aggregating
¥2,718,554 million ($28,905 million) as of March 31,
2013. Toyota estimates an additional tax provision
of ¥118,998 million ($1,265 million) would be
required if the full amount of those undistributed
earnings were remitted.
Notes to Consolidated Financial Statements
Selected Financial Summary (U.S. GAAP) Consolidated Segment Information Consolidated Quarterly Financial Summary Management’s Discussion and Analysis of Financial Condition and Results of Operations Consolidated Financial Statements Notes to Consolidated Financial Statements [17 of 44]
Management’s Annual Report on Internal Control over Financial Reporting Report of Independent Registered Public Accounting Firm