Toyota 2013 Annual Report Download - page 27
Download and view the complete annual report
Please find page 27 of the 2013 Toyota annual report below. You can navigate through the pages in the report by either clicking on the pages listed below, or by using the keyword search tool below to find specific information within the annual report.-
 1
1 -
2
-
3
-
4
-
5
-
6
-
7
-
8
-
9
-
10
-
11
-
12
-
13
-
14
-
15
-
16
-
 17
17 -
 18
18 -
 19
19 -
 20
20 -
 21
21 -
 22
22 -
 23
23 -
 24
24 -
 25
25 -
 26
26 -
 27
27 -
 28
28 -
 29
29 -
 30
30 -
 31
31 -
 32
32 -
 33
33 -
 34
34 -
 35
35 -
 36
36 -
 37
37 -
38
-
39
-
40
-
41
-
42
-
43
-
44
-
45
-
46
-
47
-
48
-
49
-
50
-
51
-
52
-
53
-
54
-
55
-
56
-
57
-
58
-
59
-
60
-
61
-
62
-
63
-
64
-
65
-
66
-
67
-
68
-
69
-
70
-
71
-
72
-
73
-
74
-
75
-
76
-
77
-
78
-
79
-
80
-
81
-
82
-
83
-
84
-
85
-
86
-
87
-
88
-
89
-
90
-
91
-
92
-
93
-
94
-
95
-
96
-
97
-
98
-
99
-
100
-
101
-
102
-
103
-
104
-
105
-
106
-
107
-
108
-
109
-
110
-
111
-
112
-
113
-
114
-
115
-
116
-
117
-
118
-
119
-
120
-
121
-
122
-
123
-
124
 |
 |
Toyota Global Vision President’s Message Launching a New Structure Special Feature Review of Operations
Consolidated Performance
Highlights
Management and
Corporate Information Investor InformationFinancial Section
Page 27
NextPrev
ContentsSearchPrint
ANNUAL REPORT 2013
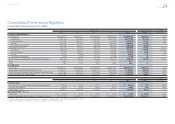
Millions of yen % change
For the years ended
March 31 2009 2010 2011 2012 2013
2013 vs.
2012
Net Revenues by Region:
Japan ¥12,186,737 ¥11,220,303 ¥10,986,246 ¥11,167,319 ¥12,821,018 +14.8
North America 6,222,914 5,670,526 5,429,136 4,751,886 6,284,425 +32.3
Europe 3,013,128 2,147,049 1,981,497 1,993,946 2,083,113 +4.5
Asia 2,719,329 2,655,327 3,374,534 3,334,274 4,385,476 +31.5
Other* 1,882,900 1,673,861 1,809,116 1,760,175 2,094,265 +19.0
Intersegment elimination/
unallocated amount
(5,495,438) (4,416,093) (4,586,841) (4,423,947) (5,604,105) —
Operating income (loss):
Japan ¥(237,531) ¥(225,242) ¥(362,396) ¥(207,040) ¥576,335 —
North America (390,192) 85,490 339,503 186,409 221,925 +19.1
Europe (143,233) (32,955) 13,148 17,796 26,462 +48.7
Asia 176,060 203,527 312,977 256,790 376,055 +46.4
Other* 87,648 115,574 160,129 108,814 133,744 +22.9
Intersegment elimination/
unallocated amount
46,237 1,122 4,918 (7,142) (13,633) —
* Central and South America, Oceania, Africa and the Middle East, etc.
25,000
0
20,000
15,000
10,000
5,000
1,000
0
800
600
400
200
-400
-200
FY
FY
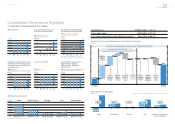
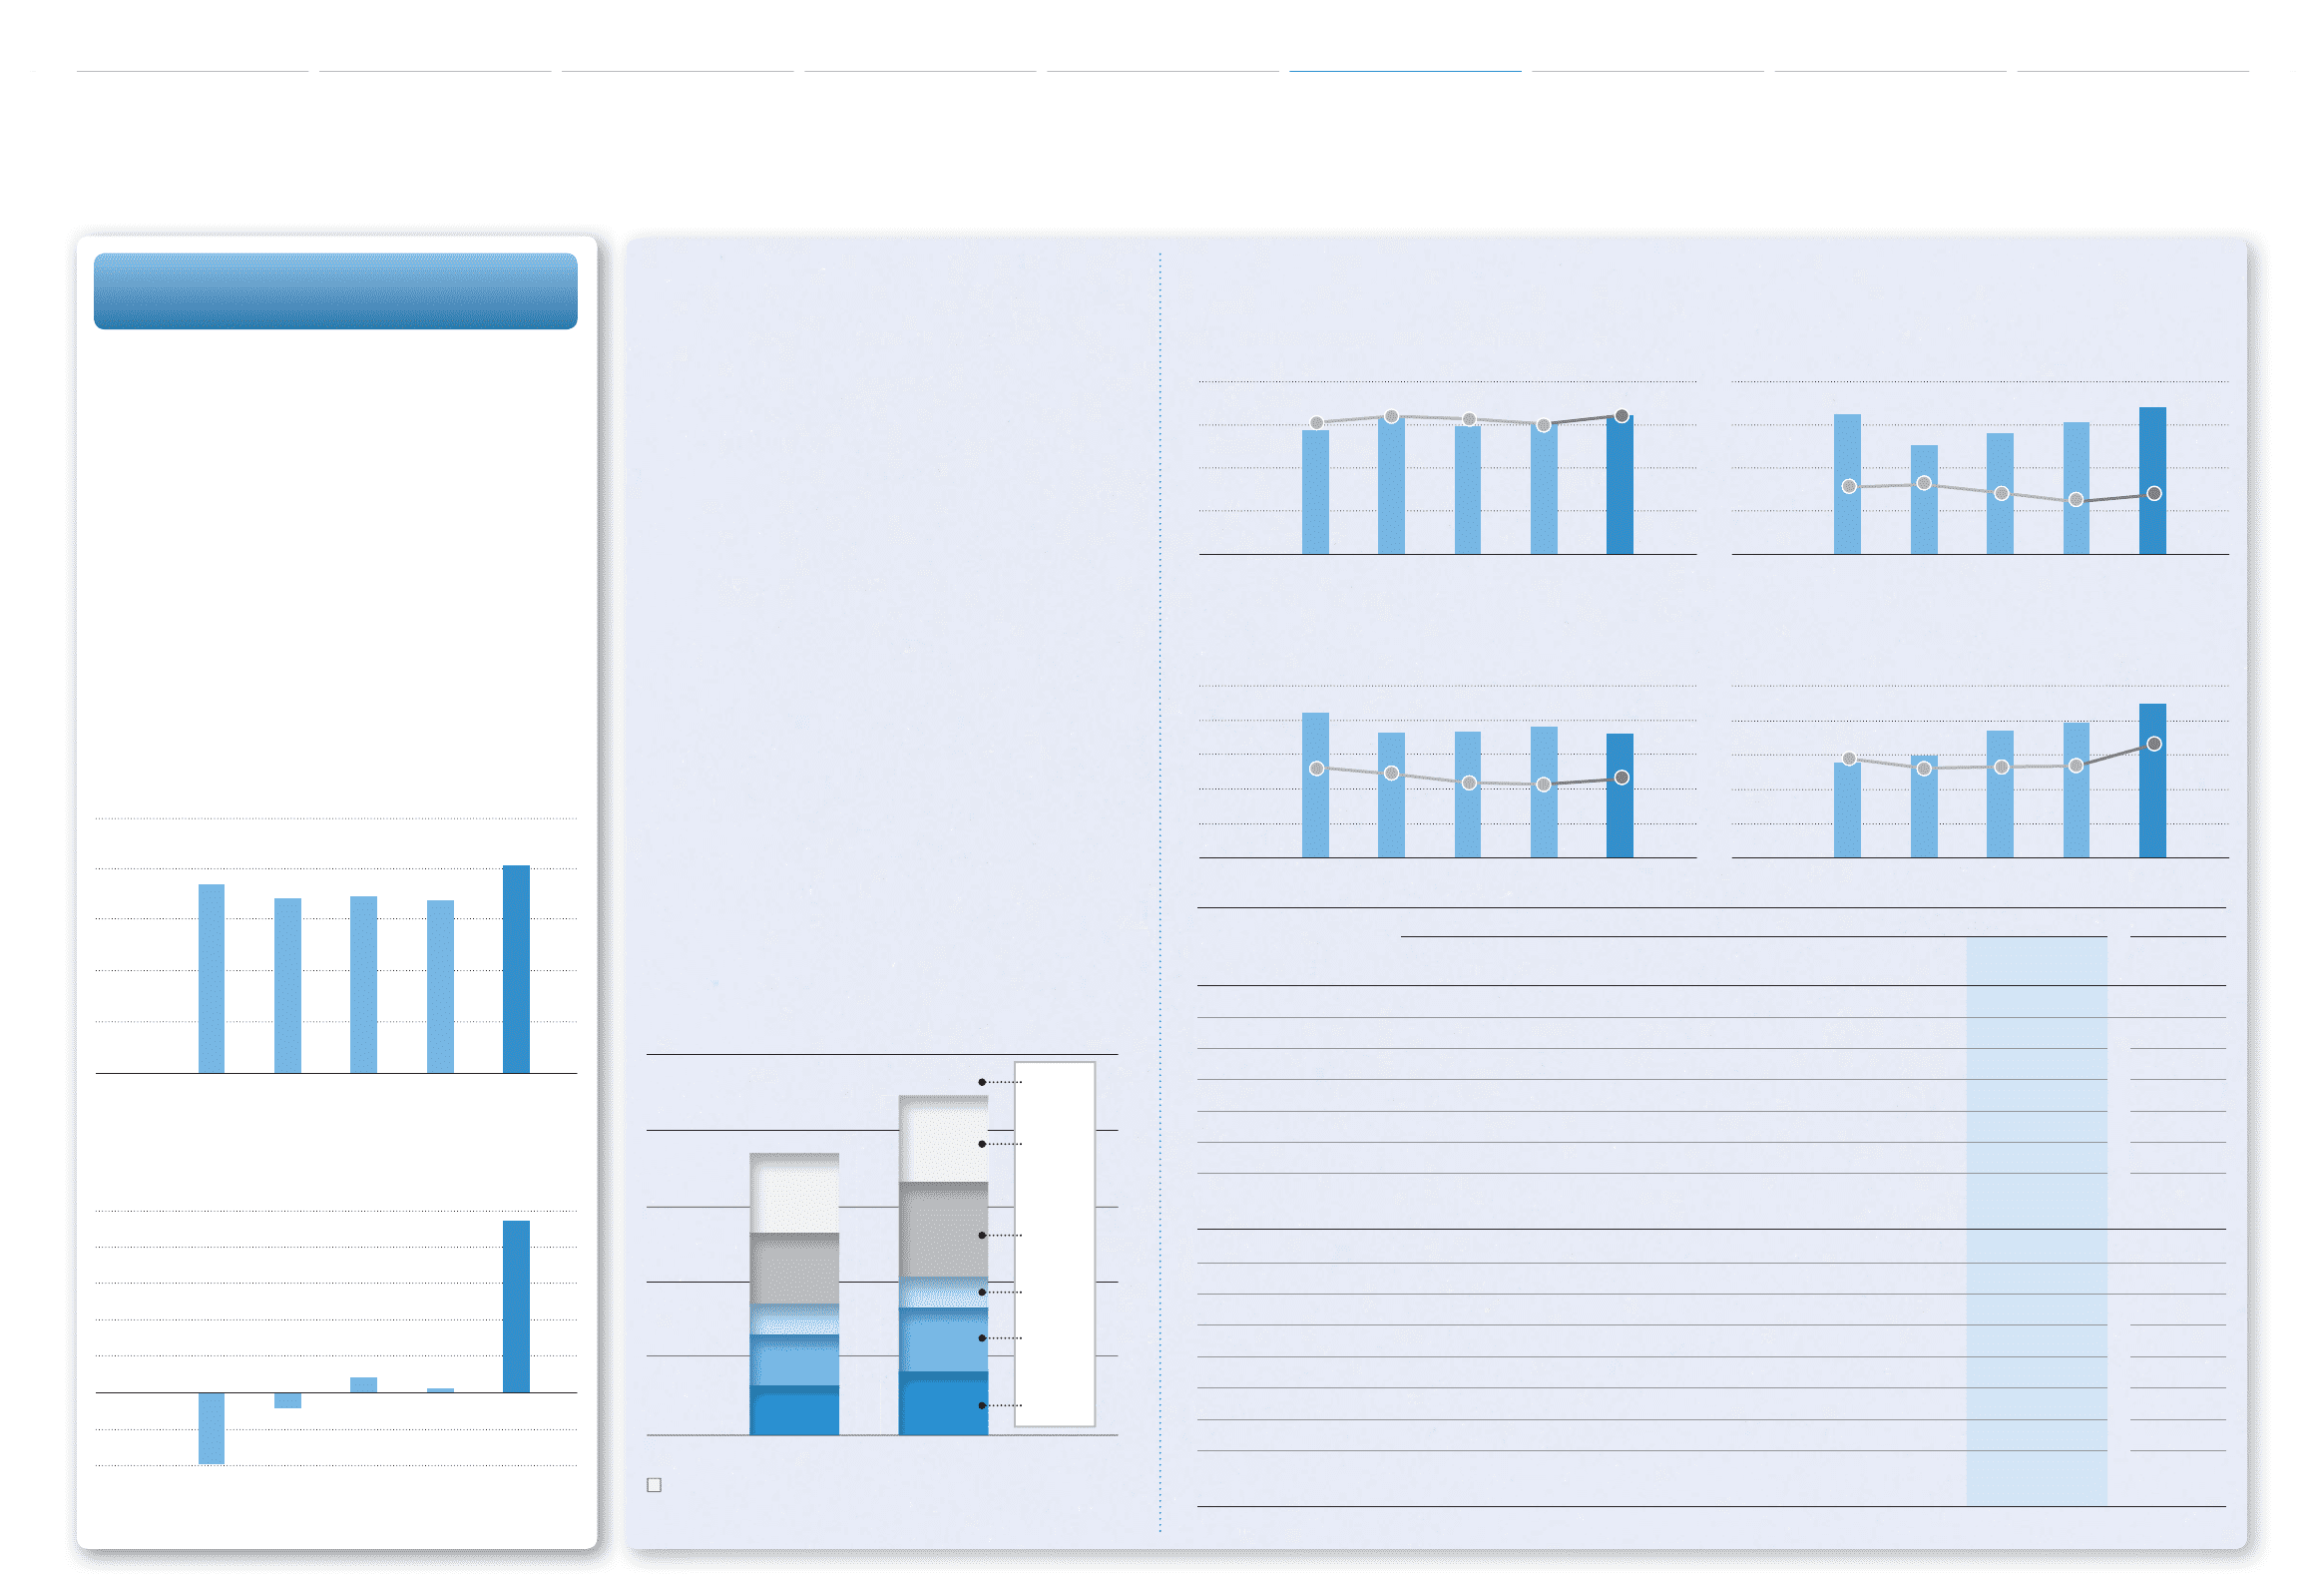
Net Revenues
(¥ Billion)
’09 ’10 ’11 ’12 ’13
Operating Income (Loss)
(¥ Billion)
’09 ’10 ’11 ’12 ’13
Note: Fiscal years ended March 31
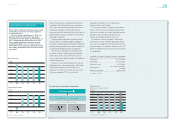
The Company works diligently to produce ever-
better cars that exceed expectations in order to
deliver products that bring smiles to the faces of
people who choose Toyota.
In the fi scal year under review, net revenues
from automotive operations totaled ¥20,419.1
billion, an increase of ¥3,424.5 billion, or 20.2%,
compared with the previous fi scal year. Operating
income also climbed by ¥923.0 billion, year on
year to ¥944.7 billion.
Looking at conditions in the automotive market,
trends mainly in the United States and emerging
regions including Asia were fi rm. Against this back-
drop, Toyota aggressively introduced new products in
Japan and successfully expanded sales thanks to the
efforts of dealers nationwide. Outside Japan, the
Company boosted vehicle sales across all regions.
The fi scal year ended March 31, 2013 marked the
15th anniversary since the launch of the Prius,
Toyota’s initial foray into the hybrid market. During the
fi scal year under review, the Company broke through
the 1,000,000 barrier in annual global vehicle sales
for hybrid cars with cumulative sales exceeding
5,000,000.
10,000
8,000
6,000
4,000
2,000
0
Consolidated Vehicle Sales
(Thousands of units)
8,871
2,279
2,469
799
1,684
1,640
7,352
2,071
1,872
798
1,327
1,284
Change
+356
+357
+1
+597
+208
’13
Japan 쏋 North America 쏋 Europe 쏋 Asia
쏋 Other*
FY ’12
+1,519
Source: Toyota Motor Corp.
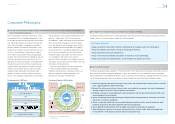
Note: Market defi nitions are as follows:
Europe: Germany, France, the United Kingdom, Italy, Spain, the Netherlands,
Belgium, Portugal, Denmark, Greece, Ireland, Sweden, Austria,
Finland, Switzerland, Norway, Poland, Hungary, and the Czech
Republic
Asia: Indonesia, Thailand, the Philippines, Malaysia, Singapore, Vietnam,
Taiwan, South Korea, and Brunei Darussalam
Japan: Mini-vehicles excluded
4,000
2,000
1,000
(Thousands of units)
60
30
3,000 45
15
(%)
20,000
10,000
5,000
(Thousands of units)
40
20
15,000 30
10
(%)
25,000
10,000
5,000
(Thousands of units)
10
4
15,000 6
20,000 8
2
(%)
10,000
4,000
2,000
(Thousands of units)
25
10
6,000 15
8,000 20
5
(%)
FY
Japan
’09 ’10 ’11 ’12 ’13
00
왎왎 Total market sales (excluding mini-vehicles)
쎲쎲 Toyota market share
CY
North America
’08 ’09 ’10 ’11 ’12
00
왎왎 Total market sales
쎲쎲 Toyota market share
CY
Europe
’08 ’09 ’10 ’11 ’12
00
왎왎 Total market sales
쎲쎲 Toyota market share
CY
Asia
’08 ’09 ’10 ’11 ’12
00
왎왎 Total market sales
쎲쎲 Toyota market share
Vehicle Sales by Principal Markets
Automotive Operations
Automotive Operations Financial Services Operations Non-Automotive Business Operations