Toyota 2013 Annual Report Download - page 75
Download and view the complete annual report
Please find page 75 of the 2013 Toyota annual report below. You can navigate through the pages in the report by either clicking on the pages listed below, or by using the keyword search tool below to find specific information within the annual report.-
 1
1 -
2
-
3
-
4
-
5
-
6
-
7
-
8
-
9
-
10
-
11
-
12
-
13
-
14
-
15
-
16
-
17
-
18
-
19
-
20
-
21
-
22
-
23
-
24
-
25
-
26
-
27
-
28
-
29
-
30
-
31
-
32
-
33
-
34
-
35
-
36
-
37
-
38
-
39
-
40
-
41
-
42
-
43
-
44
-
45
-
46
-
47
-
48
-
49
-
50
-
51
-
52
-
53
-
54
-
55
-
56
-
57
-
58
-
59
-
60
-
61
-
62
-
63
-
64
-
 65
65 -
 66
66 -
 67
67 -
 68
68 -
 69
69 -
 70
70 -
 71
71 -
 72
72 -
 73
73 -
 74
74 -
 75
75 -
 76
76 -
 77
77 -
 78
78 -
 79
79 -
 80
80 -
 81
81 -
 82
82 -
 83
83 -
 84
84 -
 85
85 -
86
-
87
-
88
-
89
-
90
-
91
-
92
-
93
-
94
-
95
-
96
-
97
-
98
-
99
-
100
-
101
-
102
-
103
-
104
-
105
-
106
-
107
-
108
-
109
-
110
-
111
-
112
-
113
-
114
-
115
-
116
-
117
-
118
-
119
-
120
-
121
-
122
-
123
-
124
 |
 |

Toyota Global Vision President’s Message Launching a New Structure Special Feature Review of Operations
Consolidated Performance
Highlights
Management and
Corporate Information Investor InformationFinancial Section
Page 75
NextPrev
ContentsSearchPrint
ANNUAL REPORT 2013
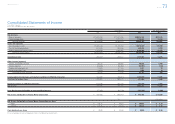
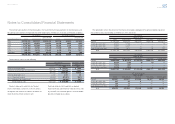
Consolidated Statements of Shareholders’ Equity
Toyota Motor Corporation
For the years ended March 31, 2011, 2012 and 2013
Yen in millions
Common
stock
Additional paid-in
capital
Retained
earnings
Accumulated other
comprehensive
income (loss)
Treasury stock,
at cost
Total Toyota Motor
Corporation
shareholders’ equity
Noncontrolling
interests
Total shareholders’
equity
Balances at March 31, 2010 ¥397,050 ¥501,331 ¥11,568,602 ¥ (846,835) ¥(1,260,425) ¥10,359,723 ¥570,720 ¥10,930,443
Equity transaction with noncontrolling interests and other 2,310 2,310 5,183 7,493
Issuance during the year 2,119 2,119 2,119
Comprehensive income
Net income 408,183 408,183 57,302 465,485
Other comprehensive income (loss)
Foreign currency translation adjustments (287,613) (287,613) (11,965) (299,578)
Unrealized gains (losses) on securities, net of reclassifi cation adjustments (26,058) (26,058) (1,599) (27,657)
Pension liability adjustments 15,785 15,785 (4,331) 11,454
Total comprehensive income 110,297 39,407 149,704
Dividends paid to Toyota Motor Corporation shareholders (141,120) (141,120) (141,120)
Dividends paid to noncontrolling interests (27,657) (27,657)
Purchase and reissuance of common stock (958) (958) (958)
Balances at March 31, 2011 ¥397,050 ¥505,760 ¥11,835,665 ¥(1,144,721) ¥(1,261,383) ¥10,332,371 ¥587,653 ¥10,920,024
Equity transaction with noncontrolling interests and other 43,311 (45,365) (6,503) 125,819 117,262 (119,824) (2,562)
Issuance during the year 1,483 1,483 1,483
Comprehensive income
Net income 283,559 283,559 84,743 368,302
Other comprehensive income (loss)
Foreign currency translation adjustments (87,729) (87,729) (5,563) (93,292)
Unrealized gains (losses) on securities, net of reclassifi cation adjustments 129,328 129,328 2,466 131,794
Pension liability adjustments (69,208) (69,208) 4,098 (65,110)
Total comprehensive income 255,950 85,744 341,694
Dividends paid to Toyota Motor Corporation shareholders (156,785) (156,785) (156,785)
Dividends paid to noncontrolling interests (37,356) (37,356)
Purchase and reissuance of common stock 96 (116) (20) (20)
Balances at March 31, 2012 ¥397,050 ¥550,650 ¥11,917,074 ¥(1,178,833) ¥(1,135,680) ¥10,550,261 ¥516,217 ¥11,066,478
Equity transaction with noncontrolling interests and other 675 675 4,961 5,636
Issuance during the year
Comprehensive income
Net income 962,163 962,163 121,319 1,083,482
Other comprehensive income (loss)
Foreign currency translation adjustments 434,638 434,638 27,116 461,754
Unrealized gains (losses) on securities, net of reclassifi cation adjustments 368,507 368,507 5,702 374,209
Pension liability adjustments 19,565 19,565 (4,854) 14,711
Total comprehensive income 1,784,873 149,283 1,934,156
Dividends paid to Toyota Motor Corporation shareholders (190,008) (190,008) (190,008)
Dividends paid to noncontrolling interests (45,640) (45,640)
Purchase and reissuance of common stock (285) (23) 2,542 2,234 2,234
Balances at March 31, 2013 ¥397,050 ¥551,040 ¥12,689,206 ¥ (356,123) ¥(1,133,138) ¥12,148,035 ¥624,821 ¥12,772,856
The accompanying notes are an integral part of these consolidated fi nancial statements.
Selected Financial Summary (U.S. GAAP) Consolidated Segment Information Consolidated Quarterly Financial Summary Management’s Discussion and Analysis of Financial Condition and Results of Operations Consolidated Financial Statements [4 of 6] Notes to Consolidated Financial Statements
Management’s Annual Report on Internal Control over Financial Reporting Report of Independent Registered Public Accounting Firm