Toyota 2013 Annual Report Download - page 22
Download and view the complete annual report
Please find page 22 of the 2013 Toyota annual report below. You can navigate through the pages in the report by either clicking on the pages listed below, or by using the keyword search tool below to find specific information within the annual report.-
 1
1 -
2
-
3
-
4
-
5
-
6
-
7
-
8
-
9
-
10
-
11
-
 12
12 -
 13
13 -
 14
14 -
 15
15 -
 16
16 -
 17
17 -
 18
18 -
 19
19 -
 20
20 -
 21
21 -
 22
22 -
 23
23 -
 24
24 -
 25
25 -
 26
26 -
 27
27 -
 28
28 -
 29
29 -
 30
30 -
 31
31 -
 32
32 -
33
-
34
-
35
-
36
-
37
-
38
-
39
-
40
-
41
-
42
-
43
-
44
-
45
-
46
-
47
-
48
-
49
-
50
-
51
-
52
-
53
-
54
-
55
-
56
-
57
-
58
-
59
-
60
-
61
-
62
-
63
-
64
-
65
-
66
-
67
-
68
-
69
-
70
-
71
-
72
-
73
-
74
-
75
-
76
-
77
-
78
-
79
-
80
-
81
-
82
-
83
-
84
-
85
-
86
-
87
-
88
-
89
-
90
-
91
-
92
-
93
-
94
-
95
-
96
-
97
-
98
-
99
-
100
-
101
-
102
-
103
-
104
-
105
-
106
-
107
-
108
-
109
-
110
-
111
-
112
-
113
-
114
-
115
-
116
-
117
-
118
-
119
-
120
-
121
-
122
-
123
-
124
 |
 |

Toyota Global Vision President’s Message Launching a New Structure Special Feature Review of Operations
Consolidated Performance
Highlights
Management and
Corporate Information Investor InformationFinancial Section
Page 22
NextPrev
ContentsSearchPrint
ANNUAL REPORT 2013
1. Growth: Sustainable growth through continuous forward-looking
investments
We believe that automotive markets worldwide will grow over the medium to
long term. As they expand, the focus of market growth is likely to shift toward
emerging markets and such fuel-effi cient options as hybrid and compact vehi-
cles. We plan to invest effi ciently and actively in these areas to meet structural
shifts in demand and to ensure long-term sustainable growth. For example, we
will prioritize the investment of management resources in the development of
next-generation environmental technologies, such as fuel cells. We will also
expand our lineup of hybrids and other eco-cars and sell them globally while
increasing sales in emerging markets by strengthening locally produced models
and building an optimized supply structure. I believe we should work to realize
a balanced business structure as stated in the Toyota Global Vision, i.e., the
“50:50 sales ratio,” with half of our sales coming from developed markets such
as Japan, the United States, and Europe and the other half from emerging
markets.
2. Effi ciency: Improving profi tability and capital effi ciency
Toyota will continue its push forward with the Toyota New Global Architecture
(TNGA), an initiative to overhaul the way we work with the goal of facilitating the
timely launch of appealing products globally. Under TNGA, we are improving
development effi ciency and making ever-better cars by standardizing parts and
components through grouped development. Moreover, Toyota has improved its
ability to invest capital effi ciently and is aiming to obtain the same results with
less outlay. We will strive to further improve our earnings structure through effi -
cient investment that emphasizes the areas in which we want to advance,
including hybrids, other eco-cars, and emerging markets.
3. Stability: Maintaining a solid fi nancial base
To ensure a solid financial base, we secure suffi cient liquidity and stable share-
holders’ equity. This allows us to maintain capital expenditure and R&D invest-
ment at levels conducive to future growth as well as to maintain working capital
at a level suffi cient for operations, even when business conditions are diffi cult
due to such factors as steep increases in raw materials prices or volatility in
foreign exchange rates. We plan to refi ne and implement measures to improve
business continuity planning in the event of a major disaster. Toyota anticipates
growth in automotive markets, propelled by a recovery in the United States and
expansion in emerging markets. We believe that, in addition to putting crisis
measures into place, maintaining adequate liquidity is essential to the imple-
mentation of forward-looking investment aimed at improving product appeal
and the development of next-generation technologies as well as to the estab-
lishment of global production and sales structures. We will continue to pursue
improvements in capital efficiency and cash flow.
Dividends and Share Acquisitions
Toyota considers the enhancement of shareholder value a priority management
policy and to this end is aiming for sustainable growth through corporate reor-
ganization to increase corporate value. We aim to pay stable, ongoing divi-
dends, targeting a consolidated payout ratio of 30%, while giving due
consideration to such factors as performance each term, investment plans,
and cash and cash equivalents. To succeed in this highly competitive industry,
we plan to use retained earnings to quickly commercialize environment- and
safety-related next-generation technologies, with emphasis on customer safety
and peace of mind. Within this context, Toyota declared an annual dividend
payment of ¥90 per share for the fiscal year ended March 31, 2013.
Toyota did not acquire its own shares in the fiscal year ended March 31, 2013.
We will continue striving to further improve profits and meet the expectations
of our shareholders.
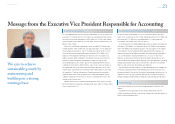
July 2013
Nobuyori Kodaira
Executive Vice President
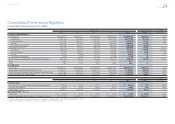
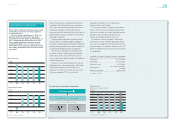
FY2014 Forecast: Consolidated Financial Summary (Billions of yen)
FY2014 Forecasts
(Apr. 1, 2013–
Mar. 31, 2014)
FY2013 Results
(Apr. 1, 2012–
Mar. 31, 2013)
Change
Net Revenues ¥23,500.0 ¥22,064.1 ¥1,435.9
Operating Income 1,800.0 1,320.8 479.2
Income before Income Taxes
and Equity in Earnings of
Affi liated Companies
1,890. 0 1,403.6 486.4
Net Income Attributable to
Toyota Motor Corporation 1,370.0 962.1 407.9
FOREX Rates Yen/US$ ¥ 90 ¥ 83 ¥ +7
Yen/Euro 120 107 +13
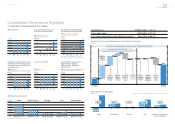
FY2014 Forecast: Consolidated Operating Income Analysis (vs. FY2013)
(Billions of yen)
Operating Income
FY2013 Results 1,320.8
Positive
Factors
Effects of FOREX Rates +400.0
Cost Reduction Efforts +160.0
Marketing Efforts +80.0
Financial Services -30.0
Subtotal +640.0
Negative
Factors
Increase in Expenses, etc. -160.8
FX Effects at Overseas Subsidiaries
(Translational) +60.0
Subtotal -160.8
Total +479.2
FY2014 Forecasts 1,800.0
10,000
8,000
6,000
4,000
2,000
0
FY2014 Forecast: Consolidated Vehicle Sales
(Thousands of units)
9,100
2,120
2,640
830
1,760
1,750
8,871
2,279
2,469
799
1,684
1,640
Change
+110
+76
+31
+171
-159
+229
FY2013 Results FY2014 Forecasts
왎 Japan 왎 North America 왎 Europe 왎 Asia 왎 Other
Message from the Executive Vice President Responsible for Accounting
Making Ever-Better Cars Enriching Lives of Communities Stable Base of Business [3 of 4]