Toyota 2013 Annual Report Download - page 84
Download and view the complete annual report
Please find page 84 of the 2013 Toyota annual report below. You can navigate through the pages in the report by either clicking on the pages listed below, or by using the keyword search tool below to find specific information within the annual report.-
 1
1 -
2
-
3
-
4
-
5
-
6
-
7
-
8
-
9
-
10
-
11
-
12
-
13
-
14
-
15
-
16
-
17
-
18
-
19
-
20
-
21
-
22
-
23
-
24
-
25
-
26
-
27
-
28
-
29
-
30
-
31
-
32
-
33
-
34
-
35
-
36
-
37
-
38
-
39
-
40
-
41
-
42
-
43
-
44
-
45
-
46
-
47
-
48
-
49
-
50
-
51
-
52
-
53
-
54
-
55
-
56
-
57
-
58
-
59
-
60
-
61
-
62
-
63
-
64
-
65
-
66
-
67
-
68
-
69
-
70
-
71
-
72
-
73
-
 74
74 -
 75
75 -
 76
76 -
 77
77 -
 78
78 -
 79
79 -
 80
80 -
 81
81 -
 82
82 -
 83
83 -
 84
84 -
 85
85 -
 86
86 -
 87
87 -
 88
88 -
 89
89 -
 90
90 -
 91
91 -
 92
92 -
 93
93 -
 94
94 -
95
-
96
-
97
-
98
-
99
-
100
-
101
-
102
-
103
-
104
-
105
-
106
-
107
-
108
-
109
-
110
-
111
-
112
-
113
-
114
-
115
-
116
-
117
-
118
-
119
-
120
-
121
-
122
-
123
-
124
 |
 |
Toyota Global Vision President’s Message Launching a New Structure Special Feature Review of Operations
Consolidated Performance
Highlights
Management and
Corporate Information Investor InformationFinancial Section
Page 84
NextPrev
ContentsSearchPrint
ANNUAL REPORT 2013
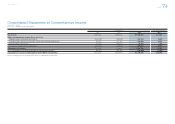
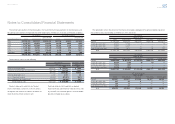
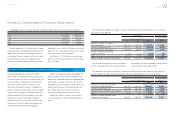
U.S. dollars in millions
March 31, 2013
Cost
Gross
unrealized
gains
Gross
unrealized
losses Fair value
Available-for-sale:
Public and corporate bonds $46,262 $ 2,244 $ 94 $48,412
Common stocks 6,373 8,553 28 14,898
Other 5,713 334 0 6,047
Total $58,348 $11,131 $122 $69,357
Securities not practicable to determine fair value:
Public and corporate bonds $ 214
Common stocks 841
Total $ 1,055
Public and corporate bonds included in available-
for-sale represent 60% of Japanese bonds, and
40% of U.S., European and other bonds as of March
31, 2012, and 49% of Japanese bonds, and 51%
of U.S., European and other bonds as of March 31,
2013. Listed stocks on the Japanese stock markets
represent 83% and 85% of common stocks which
are included in available-for-sale as of March 31,
2012 and 2013, respectively. Public and corporate
bonds include primarily government bonds, and
“Other” includes primarily investment trusts.
Unrealized losses continuing over a 12 month
period or more in the aggregate were not material at
March 31, 2012 and 2013.
As of March 31, 2012 and 2013, maturities of
public and corporate bonds and other included in
available-for-sale are mainly from 1 to 10 years.
Proceeds from sales of available-for-sale securi-
ties were ¥189,037 million, ¥162,160 million and
¥35,178 million ($374 million) for the years ended
March 31, 2011, 2012 and 2013, respectively. On
those sales, gross realized gains were ¥8,974 mil-
lion, ¥4,822 million and ¥1,048 million ($11 million)
and gross realized losses were ¥87 million, ¥15 mil-
lion and ¥31 million ($0 million), respectively.
During the years ended March 31, 2011, 2012
and 2013, Toyota recognized impairment losses on
available-for-sale securities of ¥7,915 million,
¥53,831 million and ¥2,104 million ($22 million),
respectively, which are included in “Other income
(loss), net” in the accompanying consolidated state-
ments of income.
In the ordinary course of business, Toyota main-
tains long-term investment securities, included in
“Marketable securities and other securities invest-
ments” and issued by a number of non-public com-
panies which are recorded at cost, as their fair
values were not readily determinable. Management
employs a systematic methodology to assess the
recoverability of such investments by reviewing the
fi nancial viability of the underlying companies and
the prevailing market conditions in which these
companies operate to determine if Toyota’s invest-
ment in each individual company is impaired and
whether the impairment is other-than-temporary.
Toyota periodically performs this impairment test
for signifi cant investments recorded at cost. If
the impairment is determined to be other-than-
temporary, the carrying value of the investment is
written-down by the impaired amount and the
losses are recognized currently in operations.
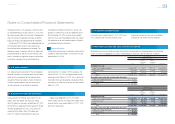
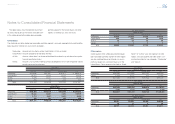
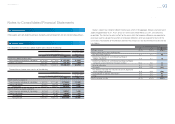
Finance receivables consist of the following:
Yen in millions U.S. dollars in millions
March 31, March 31,
2012 2013 2013
Retail ¥ 7,248,793 ¥ 9,047,782 $ 96,202
Finance leases 955,430 1,029,887 10,950
Wholesale and other dealer loans 2,033,954 2,615,728 27,812
10,238,177 12,693,397 134,964
Deferred origination costs 105,533 135,398 1,439
Unearned income (494,123) (628,340) (6,681)
Allowance for credit losses
Retail (77,353) (83,858) (892)
Finance leases (30,637) (28,928) (307)
Wholesale and other dealer loans (24,238) (26,243) (279)
Total allowance for credit losses (132,228) (139,029) (1,478)
Total fi nance receivables, net 9,717,359 12,061,426 128,244
Less—Current portion (4,114,897) (5,117,660) (54,414)
Noncurrent fi nance receivables, net ¥ 5,602,462 ¥ 6,943,766 $ 73,830
Finance receivables were geographically distribut-
ed as follows: in North America 58.1%, in Japan
12.0%, in Europe 10.3%, in Asia 7.1% and in Other
12.5% as of March 31, 2012, and in North America
57.6%, in Europe 10.0%, in Japan 9.9%, in Asia
9.5% and in Other 13.0% as of March 31, 2013.
7. Finance receivables
Notes to Consolidated Financial Statements
Selected Financial Summary (U.S. GAAP) Consolidated Segment Information Consolidated Quarterly Financial Summary Management’s Discussion and Analysis of Financial Condition and Results of Operations Consolidated Financial Statements Notes to Consolidated Financial Statements [7 of 44]
Management’s Annual Report on Internal Control over Financial Reporting Report of Independent Registered Public Accounting Firm