Toyota 2013 Annual Report Download - page 24
Download and view the complete annual report
Please find page 24 of the 2013 Toyota annual report below. You can navigate through the pages in the report by either clicking on the pages listed below, or by using the keyword search tool below to find specific information within the annual report.-
 1
1 -
2
-
3
-
4
-
5
-
6
-
7
-
8
-
9
-
10
-
11
-
12
-
13
-
 14
14 -
 15
15 -
 16
16 -
 17
17 -
 18
18 -
 19
19 -
 20
20 -
 21
21 -
 22
22 -
 23
23 -
 24
24 -
 25
25 -
 26
26 -
 27
27 -
 28
28 -
 29
29 -
 30
30 -
 31
31 -
 32
32 -
 33
33 -
 34
34 -
35
-
36
-
37
-
38
-
39
-
40
-
41
-
42
-
43
-
44
-
45
-
46
-
47
-
48
-
49
-
50
-
51
-
52
-
53
-
54
-
55
-
56
-
57
-
58
-
59
-
60
-
61
-
62
-
63
-
64
-
65
-
66
-
67
-
68
-
69
-
70
-
71
-
72
-
73
-
74
-
75
-
76
-
77
-
78
-
79
-
80
-
81
-
82
-
83
-
84
-
85
-
86
-
87
-
88
-
89
-
90
-
91
-
92
-
93
-
94
-
95
-
96
-
97
-
98
-
99
-
100
-
101
-
102
-
103
-
104
-
105
-
106
-
107
-
108
-
109
-
110
-
111
-
112
-
113
-
114
-
115
-
116
-
117
-
118
-
119
-
120
-
121
-
122
-
123
-
124
 |
 |
[1 of 3]
Toyota Global Vision President’s Message Launching a New Structure Special Feature Review of Operations
Consolidated Performance
Highlights
Management and
Corporate Information Investor InformationFinancial Section
Page 24
NextPrev
ContentsSearchPrint
ANNUAL REPORT 2013
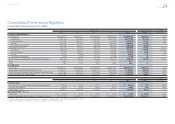
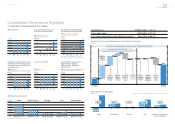
Consolidated Performance Highlights
Consolidated Performance (U.S. GAAP)
Millions of yen U.S. dollars*1 in millions % change
2009 2010 2011 2012 2013 2013 2013 vs. 2012
Fiscal years ended March 31
Net Revenues: ¥20,529,570 ¥18,950,973 ¥18,993,688 ¥18,583,653 ¥22,064,192 $234,601 +18.7
Automotive 18,564,723 17,197,428 17,337,320 16,994,546 20,419,100 217,109 +20.2
Financial Services 1,377,548 1,245,407 1,192,205 1,100,324 1,170,670 12,447 +6.4
All Other 1,184,947 947,615 972,252 1,048,915 1,066,461 11,339 +1.7
Inter-Segment Elimination (597,648) (439,477) (508,089) (560,132) (592,039) (6,294) —
Operating Income (Loss): (461,011) 147,516 468,279 355,627 1,320,888 14,045 +271.4
Automotive (394,876) (86,370) 85,973 21,683 944,704 10,045 +4,256.9
Financial Services (71,947) 246,927 358,280 306,438 315,820 3,358 +3.1
All Other 9,913 (8,860) 35,242 42,062 53,616 570 +27.5
Inter-Segment Elimination (4,101) (4,181) (11,216) (14,556) 6,748 72 —
Net Income (Loss) Attributable to Toyota Motor Corporation*2(436,937) 209,456 408,183 283,559 962,163 10,230 +239.3
ROE -4.0% 2.1% 3.9% 2.7% 8.5% — —
ROA -1.4% 0.7% 1.4% 0.9% 2.9% — —
As of March 31
Total Assets ¥29,062,037 ¥30,349,287 ¥29,818,166 ¥30,650,965 ¥35,483,317 $377,281 +15.8
Toyota Motor Corporation Shareholders’ Equity 10,061,207 10,359,723 10,332,371 10,550,261 12,148,035 129,166 +15.1
Short-Term Debt, Including Current Portion of Long-Term Debt 6,317,184 5,497,997 5,951,836 5,963,269 6,793,956 72,237 +13.9
Long-Term Debt, less Current Portion 6,301,469 7,015,409 6,449,220 6,042,277 7,337,824 78,020 +21.4
Yen U.S. dollars*1% change
2009 2010 2011 2012 2013 2013 2013 vs. 2012
Per Share Data:
Net Income (Loss) Attributable to Toyota Motor Corporation*2¥ (139.13) ¥ 66.79 ¥ 130.17 ¥ 90.21 ¥ 303.82 $ 3.23 +236.8
Annual Cash Dividends 100.00 45.00 50.00 50.00 90.00 0.96 +80.0
Shareholders’ Equity 3,208.41 3,303.49 3,295.08 3,331.51 3,835.30 40.78 +15.1
Stock Information (March 31)
Stock Price ¥ 3,120 ¥ 3,745 ¥ 3,350 ¥ 3,570 ¥ 4,860 $ 51.67 +36.1
Market Capitalization (Yen in millions, U.S. dollars in millions) ¥10,757,752 ¥12,912,751 ¥11,550,792 ¥12,309,351 ¥16,757,268 $178,174 +36.1
*1: U.S. dollar amounts have been translated at the rate of ¥94.05=US$1, the approximate current exchange rate at March 31, 2013.
*2: “Net Income attributable to Toyota Motor Corporation”, equivalent to “Net Income” up to 2009.