Toyota 2013 Annual Report Download - page 121
Download and view the complete annual report
Please find page 121 of the 2013 Toyota annual report below. You can navigate through the pages in the report by either clicking on the pages listed below, or by using the keyword search tool below to find specific information within the annual report.-
 1
1 -
2
-
3
-
4
-
5
-
6
-
7
-
8
-
9
-
10
-
11
-
12
-
13
-
14
-
15
-
16
-
17
-
18
-
19
-
20
-
21
-
22
-
23
-
24
-
25
-
26
-
27
-
28
-
29
-
30
-
31
-
32
-
33
-
34
-
35
-
36
-
37
-
38
-
39
-
40
-
41
-
42
-
43
-
44
-
45
-
46
-
47
-
48
-
49
-
50
-
51
-
52
-
53
-
54
-
55
-
56
-
57
-
58
-
59
-
60
-
61
-
62
-
63
-
64
-
65
-
66
-
67
-
68
-
69
-
70
-
71
-
72
-
73
-
74
-
75
-
76
-
77
-
78
-
79
-
80
-
81
-
82
-
83
-
84
-
85
-
86
-
87
-
88
-
89
-
90
-
91
-
92
-
93
-
94
-
95
-
96
-
97
-
98
-
99
-
100
-
101
-
102
-
103
-
104
-
105
-
106
-
107
-
108
-
109
-
110
-
 111
111 -
 112
112 -
 113
113 -
 114
114 -
 115
115 -
 116
116 -
 117
117 -
 118
118 -
 119
119 -
 120
120 -
 121
121 -
 122
122 -
 123
123 -
 124
124
 |
 |

Toyota Global Vision President’s Message Launching a New Structure Special Feature Review of Operations
Consolidated Performance
Highlights
Management and
Corporate Information Investor InformationFinancial Section
Page 121
NextPrev
ContentsSearchPrint
ANNUAL REPORT 2013
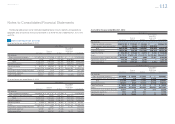
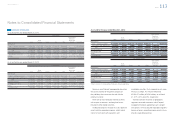
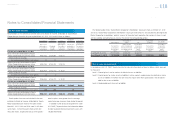
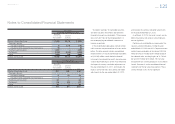
Yen in millions
For the year ended March 31, 2013
Marketable
securities and
other securities
investments
Derivative
fi nancial
instruments Total
Balance at beginning of year ¥1,684 ¥4,739 ¥ 6,423
Total gains (losses)
Included in earnings 24 2,118 2,142
Included in other comprehensive income (loss) 58 — 58
Purchases and issuances 3,607 — 3,607
Settlements (1,563) (2,343) (3,906)
Other 3,079 613 3,692
Balance at end of year ¥6,889 ¥5,127 ¥12,016
U.S. dollars in millions
For the year ended March 31, 2013
Marketable
securities and
other securities
investments
Derivative
fi nancial
instruments Total
Balance at beginning of year $18 $50 $ 68
Total gains (losses)
Included in earnings 022 22
Included in other comprehensive income (loss) 1— 1
Purchases and issuances 38 — 38
Settlements (16) (25) (41)
Other 32 7 39
Balance at end of year $73 $54 $127
“Included in earnings” in marketable securities
and other securities investments and derivative
fi nancial instruments are included in “Other income
(loss), net” and “Cost of fi nancing operations” in
the accompanying consolidated statements of
income, respectively.
In the reconciliation table above, derivative fi nan-
cial instruments are presented net of assets and lia-
bilities. The other amount includes consolidated
retained interests in securitized fi nancial receivables
of ¥(13,165) million, certain derivative fi nancial
instruments transferred into Level 2 due to be mea-
sured at observable inputs of ¥(21,413) million and
the impact of currency translation adjustments for
the year ended March 31, 2011, and includes the
impacts of level transfers and currency translation
adjustments for the year ended March 31, 2012,
and includes the currency translation adjustments
for the year ended March 31, 2013.
As of March 31, 2013, the Level 3 assets and lia-
bilities measured at fair value on a recurring basis
are not signifi cant.
Certain assets and liabilities are measured at fair
value on a nonrecurring basis. During the years
ended March 31, 2012 and 2013, Toyota measured
certain fi nance receivables at fair value of ¥32,056
million and ¥32,974 million ($351 million) based on
the collateral value, resulting in gains of ¥1,736 mil-
lion and ¥978 million ($10 million). This fair value
measurement on a nonrecurring basis is classifi ed in
Level 3. See note 21 to the consolidated fi nancial
statements for the fair value measurement. These
Level 3 fi nancial assets are not signifi cant.
Notes to Consolidated Financial Statements
Selected Financial Summary (U.S. GAAP) Consolidated Segment Information Consolidated Quarterly Financial Summary Management’s Discussion and Analysis of Financial Condition and Results of Operations Consolidated Financial Statements Notes to Consolidated Financial Statements [44 of 44]
Management’s Annual Report on Internal Control over Financial Reporting Report of Independent Registered Public Accounting Firm