Toyota 2013 Annual Report Download - page 118
Download and view the complete annual report
Please find page 118 of the 2013 Toyota annual report below. You can navigate through the pages in the report by either clicking on the pages listed below, or by using the keyword search tool below to find specific information within the annual report.-
 1
1 -
2
-
3
-
4
-
5
-
6
-
7
-
8
-
9
-
10
-
11
-
12
-
13
-
14
-
15
-
16
-
17
-
18
-
19
-
20
-
21
-
22
-
23
-
24
-
25
-
26
-
27
-
28
-
29
-
30
-
31
-
32
-
33
-
34
-
35
-
36
-
37
-
38
-
39
-
40
-
41
-
42
-
43
-
44
-
45
-
46
-
47
-
48
-
49
-
50
-
51
-
52
-
53
-
54
-
55
-
56
-
57
-
58
-
59
-
60
-
61
-
62
-
63
-
64
-
65
-
66
-
67
-
68
-
69
-
70
-
71
-
72
-
73
-
74
-
75
-
76
-
77
-
78
-
79
-
80
-
81
-
82
-
83
-
84
-
85
-
86
-
87
-
88
-
89
-
90
-
91
-
92
-
93
-
94
-
95
-
96
-
97
-
98
-
99
-
100
-
101
-
102
-
103
-
104
-
105
-
106
-
107
-
 108
108 -
 109
109 -
 110
110 -
 111
111 -
 112
112 -
 113
113 -
 114
114 -
 115
115 -
 116
116 -
 117
117 -
 118
118 -
 119
119 -
 120
120 -
 121
121 -
 122
122 -
 123
123 -
 124
124
 |
 |
Toyota Global Vision President’s Message Launching a New Structure Special Feature Review of Operations
Consolidated Performance
Highlights
Management and
Corporate Information Investor InformationFinancial Section
Page 118
NextPrev
ContentsSearchPrint
ANNUAL REPORT 2013
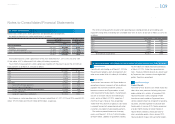
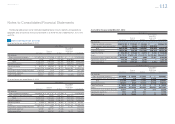
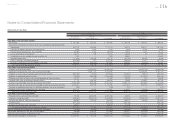
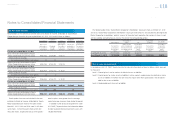
Reconciliations of the differences between basic and diluted net income attributable to Toyota Motor
Corporation per share for the years ended March 31, 2011, 2012 and 2013 are as follows:
Yen in millions
Thousands of
shares Yen
U.S. dollars
in millions U.S. dollars
Net income
attributable to
Toyota Motor
Corporation
Weighted-
average
shares
Net income
attributable to
Toyota Motor
Corporation
per share
Net income
attributable to
Toyota Motor
Corporation
Net income
attributable to
Toyota Motor
Corporation
per share
For the year ended March 31, 2011
Basic net income attributable to Toyota
Motor Corporation per common share ¥408,183 3,135,881 ¥130.17
Effect of dilutive securities
Assumed exercise of dilutive stock options (0) 34
Diluted net income attributable to Toyota
Motor Corporation per common share ¥408,183 3,135,915 ¥130.16
For the year ended March 31, 2012
Basic net income attributable to Toyota
Motor Corporation per common share ¥283,559 3,143,470 ¥ 90.21
Effect of dilutive securities
Assumed exercise of dilutive stock options (3) 0
Diluted net income attributable to Toyota
Motor Corporation per common share ¥283,556 3,143,470 ¥ 90.20
For the year ended March 31, 2013
Basic net income attributable to Toyota
Motor Corporation per common share ¥962,163 3,166,909 ¥303.82 $10,230 $3.23
Effect of dilutive securities
Assumed exercise of dilutive stock options (32) 246 (0)
Diluted net income attributable to Toyota
Motor Corporation per common share ¥962,131 3,167,155 ¥303.78 $10,230 $3.23
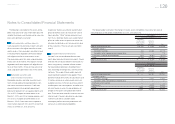
Stock options that were not included in the com-
putation of diluted net income attributable to Toyota
Motor Corporation per share for the years ended
March 31, 2011, 2012 and 2013 were 12,403 thou-
sand shares, 12,530 thousand shares and 8,682
thousand shares, respectively, because the options’
exercise prices were greater than the average
market price per common share during the period.
In addition to the disclosure requirements under
U.S. GAAP, Toyota discloses the information below
in order to provide fi nancial statements users with
valuable information.
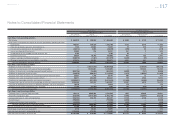
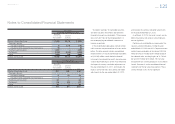
25. Per share amounts The following table shows Toyota Motor Corporation shareholders’ equity per share as of March 31, 2012
and 2013. Toyota Motor Corporation shareholders’ equity per share amounts are calculated by dividing Toyota
Motor Corporation shareholders’ equities’ amount at the end of each period by the number of shares issued
and outstanding, excluding treasury stock at the end of the corresponding period.
Yen in millions
Thousands of
shares Yen
U.S. dollars
in millions U.S. dollars
Toyota Motor
Corporation
Shareholders’
equity
Shares issued
and outstanding at
the end of the year
(excluding treasury
stock)
Toyota Motor
Corporation
Shareholders’
equity
per share
Toyota Motor
Corporation
Shareholders’
equity
Toyota Motor
Corporation
Shareholders’
equity
per share
As of March 31, 2012 ¥10,550,261 3,166,810 ¥3,331.51
As of March 31, 2013 12,148,035 3,167,429 3,835.30 $129,166 $40.78
In accordance with U.S. GAAP, Toyota classifi es fair value into three levels of input as follows which are used
to measure it.
Level 1: Quoted prices in active markets for identical assets or liabilities
Level 2: Quoted prices for similar assets or liabilities in active markets; quoted prices for identical or similar
assets or liabilities in markets that are not active; inputs other than quoted prices that are observ-
able for the assets or liabilities
Level 3: Unobservable inputs for assets or liabilities
26. Fair value measurements
Notes to Consolidated Financial Statements
Selected Financial Summary (U.S. GAAP) Consolidated Segment Information Consolidated Quarterly Financial Summary Management’s Discussion and Analysis of Financial Condition and Results of Operations Consolidated Financial Statements Notes to Consolidated Financial Statements [41 of 44]
Management’s Annual Report on Internal Control over Financial Reporting Report of Independent Registered Public Accounting Firm