Toyota 2013 Annual Report Download - page 45
Download and view the complete annual report
Please find page 45 of the 2013 Toyota annual report below. You can navigate through the pages in the report by either clicking on the pages listed below, or by using the keyword search tool below to find specific information within the annual report.-
 1
1 -
2
-
3
-
4
-
5
-
6
-
7
-
8
-
9
-
10
-
11
-
12
-
13
-
14
-
15
-
16
-
17
-
18
-
19
-
20
-
21
-
22
-
23
-
24
-
25
-
26
-
27
-
28
-
29
-
30
-
31
-
32
-
33
-
34
-
 35
35 -
 36
36 -
 37
37 -
 38
38 -
 39
39 -
 40
40 -
 41
41 -
 42
42 -
 43
43 -
 44
44 -
 45
45 -
 46
46 -
 47
47 -
 48
48 -
 49
49 -
 50
50 -
 51
51 -
 52
52 -
 53
53 -
 54
54 -
 55
55 -
56
-
57
-
58
-
59
-
60
-
61
-
62
-
63
-
64
-
65
-
66
-
67
-
68
-
69
-
70
-
71
-
72
-
73
-
74
-
75
-
76
-
77
-
78
-
79
-
80
-
81
-
82
-
83
-
84
-
85
-
86
-
87
-
88
-
89
-
90
-
91
-
92
-
93
-
94
-
95
-
96
-
97
-
98
-
99
-
100
-
101
-
102
-
103
-
104
-
105
-
106
-
107
-
108
-
109
-
110
-
111
-
112
-
113
-
114
-
115
-
116
-
117
-
118
-
119
-
120
-
121
-
122
-
123
-
124
 |
 |

Toyota Global Vision President’s Message Launching a New Structure Special Feature Review of Operations
Consolidated Performance
Highlights
Management and
Corporate Information Investor InformationFinancial Section
Page 45
NextPrev
ContentsSearchPrint
ANNUAL REPORT 2013
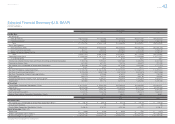
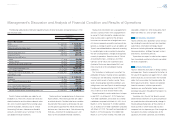
Yen in billions
2012 2013
First Quarter Second Quarter Third Quarter Fourth Quarter First Quarter Second Quarter Third Quarter Fourth Quarter
Net Revenues ¥3,441.0 ¥4,574.9 ¥4,865.2 ¥5,702.5 ¥5,501.5 ¥5,406.7 ¥5,318.7 ¥5,837.0
% Change -29.4% -4.8% 4.1% 22.8% 59.9% 18.2% 9.3% 2.4%
Operating Income (Loss) (108.0) 75.4 149.6 238.5 353.1 340.6 124.7 502.3
% Change —% -32.4% 51.1% 417.5% —% 351.8% -16.7% 110.6%
Operating Income Margin -3.1% 1.6% 3.1% 4.2% 6.4% 6.3% 2.3% 8.6%
Income (Loss) before Income Taxes and Equity in Earnings of Affi liated Companies (80.5) 79.1 198.6 235.6 415.2 379.3 131.2 477.8
% Change —% -38.7% 53.2% 467.2% —% 379.4% -33.9% 102.8%
Net Income Attributable to Toyota Motor Corporation 1.1 80.4 80.9 121.0 290.3 257.9 99.9 313.9
% Change -99.4% -18.5% -13.5% 376.5% 24,929.9% 220.7% 23.4% 159.4%
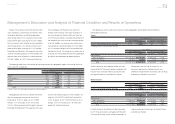
Business Segment:
Net Revenues:
Automotive ¥3,060.8 ¥4,183.1 ¥4,471.4 ¥5,279.0 ¥5,120.1 ¥5,008.7 ¥4,889.2 ¥5,401.0
Financial Services 285.8 271.0 271.5 272.0 274.4 272.0 301.3 322.8
All Other 190.5 255.2 272.2 331.0 243.2 252.6 262.0 308.4
Intersegment Elimination (96.1) (134.4) (149.9) (179.6) (136.2) (126.6) (133.8) (195.2)
Consolidated ¥3,441.0 ¥4,574.9 ¥4,865.2 ¥5,702.5 ¥5,501.5 ¥5,406.7 ¥5,318.7 ¥5,837.0
Operating Income (Loss):
Automotive ¥ (202.5) ¥ (7.5) ¥ 57.1 ¥ 174.5 ¥ 258.6 ¥ 239.3 ¥ 43.7 ¥ 402.9
Financial Services 94.6 76.4 83.5 51.9 86.7 87.7 69.0 72.2
All Other (2.0) 9.9 15.3 18.8 9.3 13.1 15.4 15.7
Intersegment Elimination 1.9 (3.4) (6.3) (6.7) (1.6) 0.3 (3.4) 11.4
Consolidated ¥ (108.0) ¥ 75.4 ¥ 149.6 ¥ 238.5 ¥ 353.1 ¥ 340.6 ¥ 124.7 ¥ 502.3
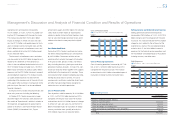
Geographic Information:
Net Revenues:
Japan ¥1,784.5 ¥2,869.0 ¥3,024.2 ¥3,489.6 ¥3,242.2 ¥3,163.9 ¥2,976.2 ¥3,438.5
North America 853.5 1,085.7 1,379.5 1,432.9 1,592.8 1,450.9 1,525.0 1,715.6
Europe 459.9 499.2 527.0 507.8 512.0 497.5 508.3 565.1
Asia 700.0 827.3 704.2 1,102.9 1,073.6 1,088.2 1,112.5 1,110.9
Other 368.8 455.3 460.2 475.9 483.4 500.8 530.3 579.5
Intersegment Elimination (725.7) (1,161.6) (1,229.9) (1,306.7) (1,402.7) (1,294.8) (1,333.8) (1,572.7)
Consolidated ¥3,441.0 ¥4,574.9 ¥4,865.2 ¥5,702.5 ¥5,501.5 ¥5,406.7 ¥5,318.7 ¥5,837.0
Operating Income (Loss):
Japan ¥ (206.6) ¥ (69.3) ¥ (30.5) ¥ 99.4 ¥ 107.1 ¥ 143.7 ¥ 15.6 ¥ 309.8
North America 28.9 32.5 90.3 34.5 117.6 64.9 (17.1) 56.4
Europe (7.5) 5.6 10.4 9.2 3.4 8.6 9.2 5.1
Asia 60.1 70.4 40.5 85.7 101.5 92.9 91.7 89.7
Other 21.0 37.1 37.9 12.8 27.1 31.5 32.3 42.6
Intersegment Elimination (3.9) (0.9) 1.0 (3.3) (3.7) (1.2) (7.1) (1.4)
Consolidated ¥ (108.0) ¥ 75.4 ¥ 149.6 ¥ 238.5 ¥ 353.1 ¥ 340.6 ¥ 124.7 ¥ 502.3
Consolidated Quarterly Financial Summary
Toyota Motor Corporation
Fiscal years ended March 31
Selected Financial Summary (U.S. GAAP) Consolidated Segment Information Consolidated Quarterly Financial Summary Management’s Discussion and Analysis of Financial Condition and Results of Operations Consolidated Financial Statements Notes to Consolidated Financial Statements
Management’s Annual Report on Internal Control over Financial Reporting Report of Independent Registered Public Accounting Firm