Toyota 2013 Annual Report Download - page 72
Download and view the complete annual report
Please find page 72 of the 2013 Toyota annual report below. You can navigate through the pages in the report by either clicking on the pages listed below, or by using the keyword search tool below to find specific information within the annual report.-
 1
1 -
2
-
3
-
4
-
5
-
6
-
7
-
8
-
9
-
10
-
11
-
12
-
13
-
14
-
15
-
16
-
17
-
18
-
19
-
20
-
21
-
22
-
23
-
24
-
25
-
26
-
27
-
28
-
29
-
30
-
31
-
32
-
33
-
34
-
35
-
36
-
37
-
38
-
39
-
40
-
41
-
42
-
43
-
44
-
45
-
46
-
47
-
48
-
49
-
50
-
51
-
52
-
53
-
54
-
55
-
56
-
57
-
58
-
59
-
60
-
61
-
 62
62 -
 63
63 -
 64
64 -
 65
65 -
 66
66 -
 67
67 -
 68
68 -
 69
69 -
 70
70 -
 71
71 -
 72
72 -
 73
73 -
 74
74 -
 75
75 -
 76
76 -
 77
77 -
 78
78 -
 79
79 -
 80
80 -
 81
81 -
 82
82 -
83
-
84
-
85
-
86
-
87
-
88
-
89
-
90
-
91
-
92
-
93
-
94
-
95
-
96
-
97
-
98
-
99
-
100
-
101
-
102
-
103
-
104
-
105
-
106
-
107
-
108
-
109
-
110
-
111
-
112
-
113
-
114
-
115
-
116
-
117
-
118
-
119
-
120
-
121
-
122
-
123
-
124
 |
 |
Toyota Global Vision President’s Message Launching a New Structure Special Feature Review of Operations
Consolidated Performance
Highlights
Management and
Corporate Information Investor InformationFinancial Section
Page 72
NextPrev
ContentsSearchPrint
ANNUAL REPORT 2013
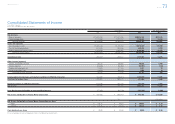
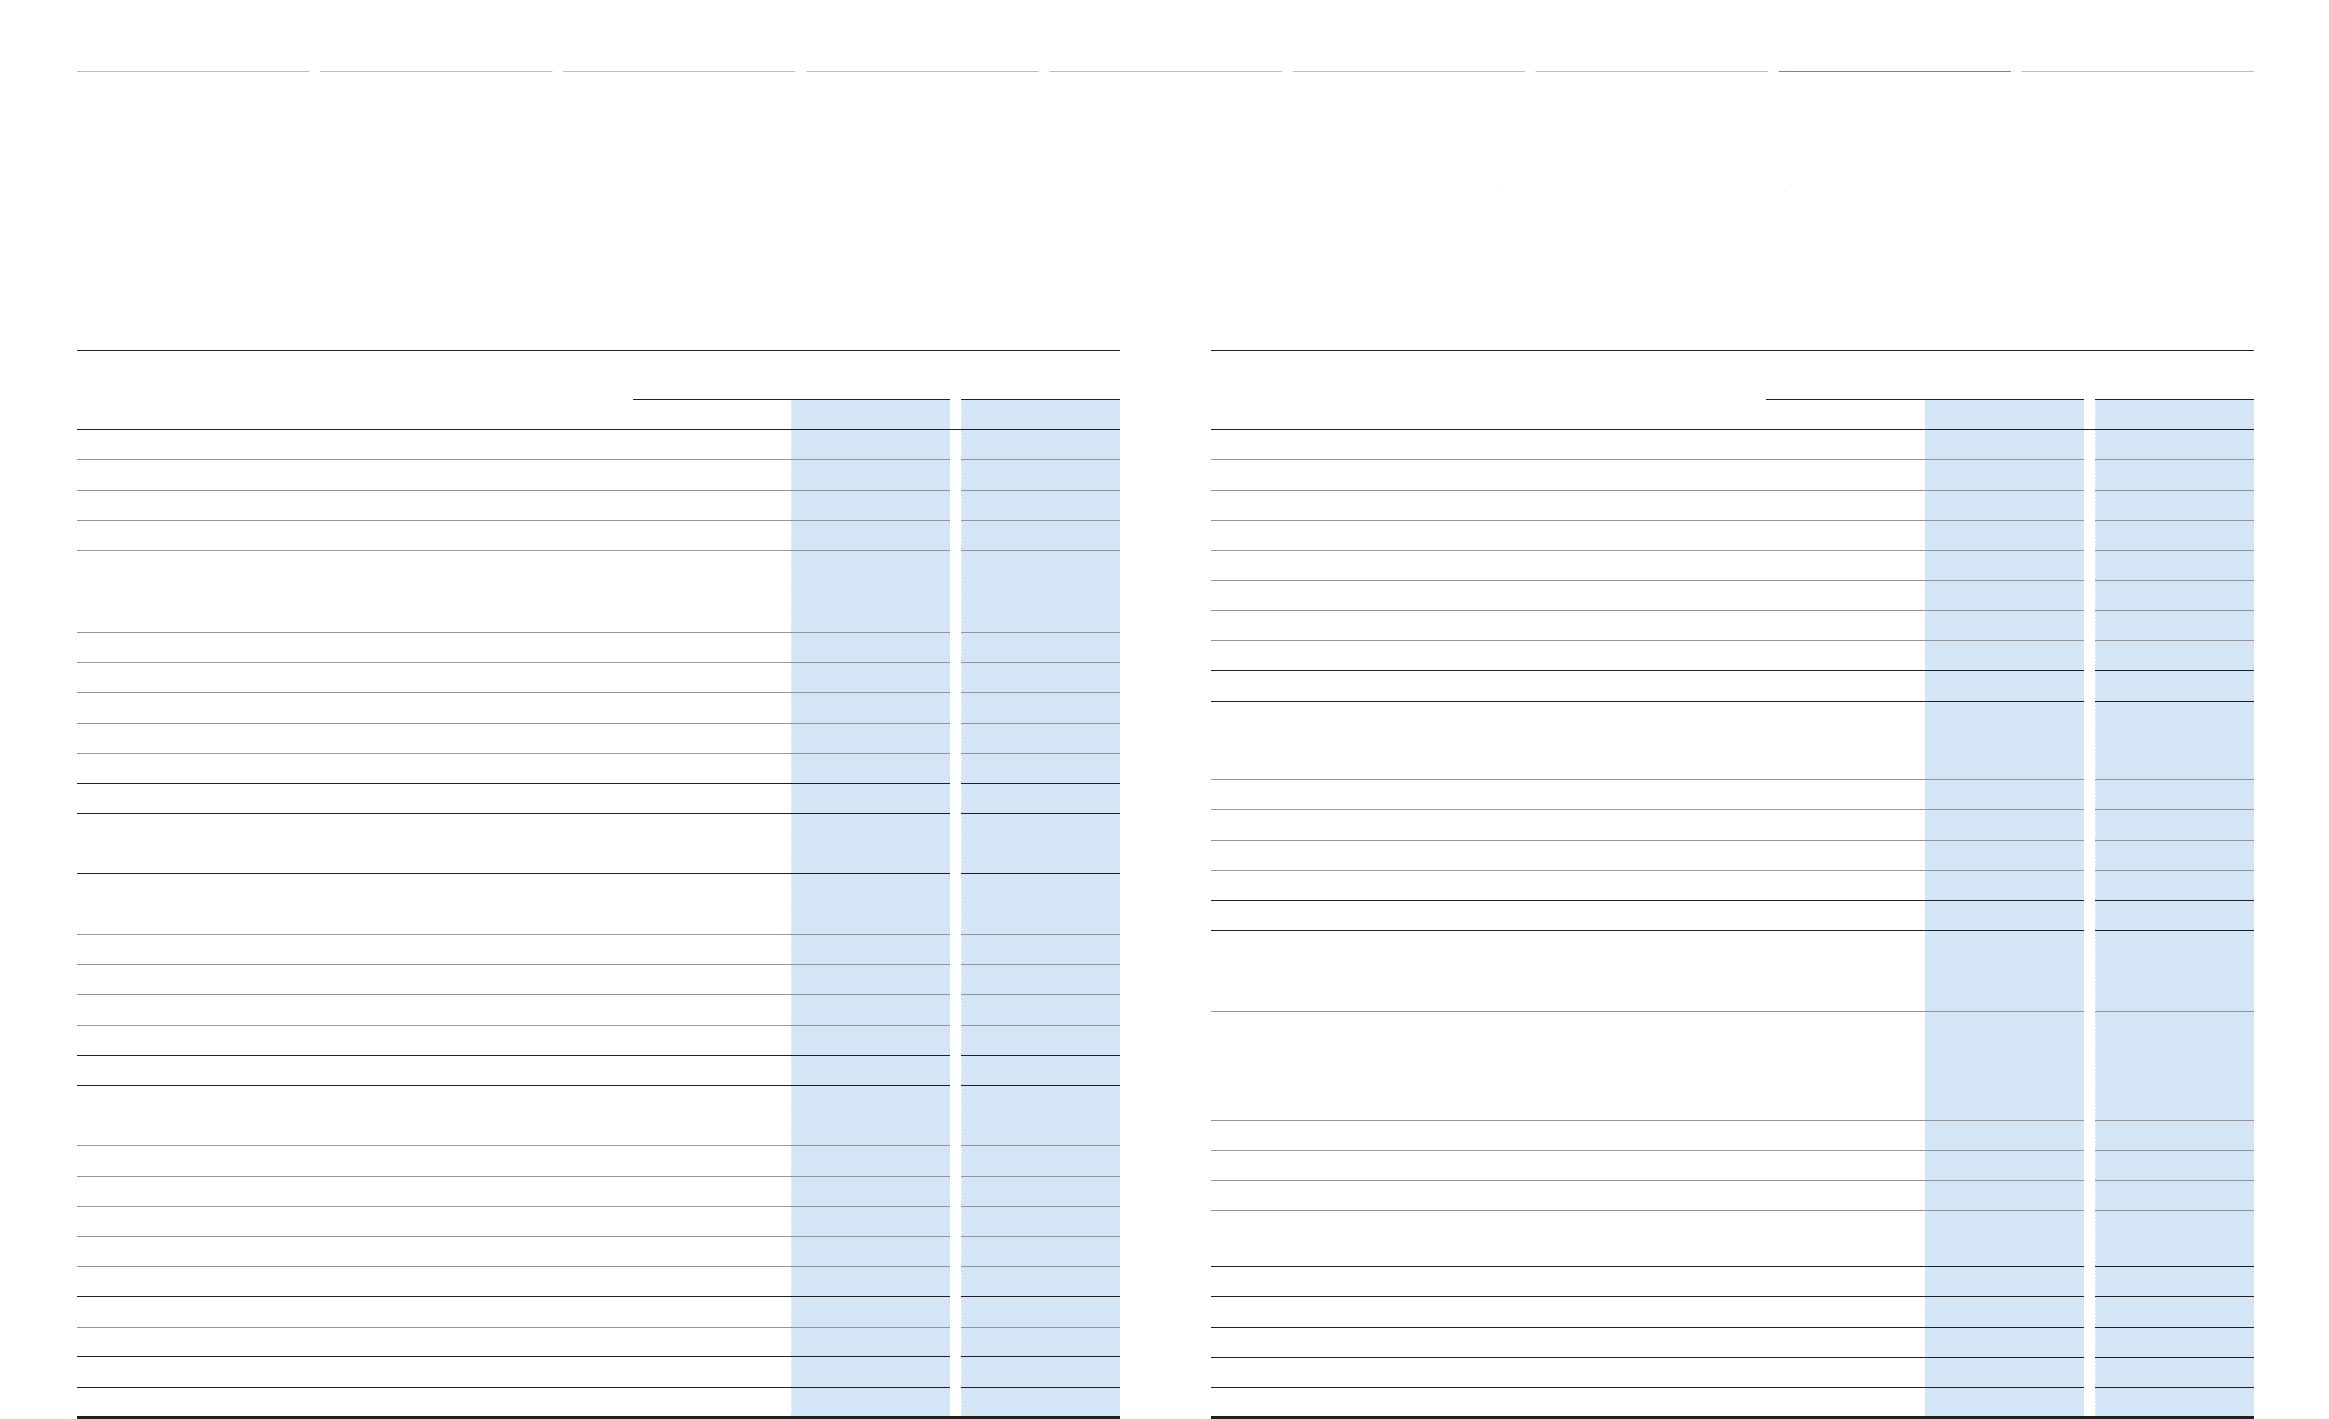
Consolidated Balance Sheets
Toyota Motor Corporation
March 31, 2012 and 2013
Yen in millions
U.S. dollars
in millions
ASSETS 2012 2013 2013
Current assets
Cash and cash equivalents ¥ 1,679,200 ¥ 1,718,297 $ 18,270
Time deposits 80,301 106,700 1,135
Marketable securities 1,181,070 1,445,663 15,371
Trade accounts and notes receivable, less allowance for
doubtful accounts of ¥13,004 million in 2012 and
¥15,875 million ($169 million) in 2013 1,999,827 1,971,659 20,964
Finance receivables, net 4,114,897 5,117,660 54,414
Other receivables 408,547 432,693 4,601
Inventories 1,622,282 1,715,786 18,243
Deferred income taxes 718,687 749,398 7,968
Prepaid expenses and other current assets 516,378 527,034 5,604
Total current assets 12,321,189 13,784,890 146,570
Noncurrent fi nance receivables, net 5,602,462 6,943,766 73,830
Investments and other assets
Marketable securities and other securities investments 4,053,572 5,176,582 55,041
Affi liated companies 1,920,987 2,103,283 22,363
Employees receivables 56,524 53,741 571
Other 460,851 569,816 6,059
Total investments and other assets 6,491,934 7,903,422 84,034
Property, plant and equipment
Land 1,243,261 1,303,611 13,861
Buildings 3,660,912 3,874,279 41,194
Machinery and equipment 9,094,399 9,716,180 103,308
Vehicles and equipment on operating leases 2,575,353 3,038,011 32,302
Construction in progress 275,357 291,539 3,100
Total property, plant and equipment, at cost 16,849,282 18,223,620 193,765
Less—Accumulated depreciation (10,613,902) (11,372,381) (120,918)
Total property, plant and equipment, net 6,235,380 6,851,239 72,847
Total assets ¥30,650,965 ¥35,483,317 $377,281
The accompanying notes are an integral part of these consolidated fi nancial statements.
Yen in millions
U.S. dollars
in millions
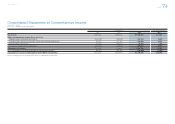
LIABILITIES AND SHAREHOLDERS’ EQUITY 2012 2013 2013
Current liabilities
Short-term borrowings ¥ 3,450,649 ¥ 4,089,528 $ 43,482
Current portion of long-term debt 2,512,620 2,704,428 28,755
Accounts payable 2,242,583 2,113,778 22,475
Other payables 629,093 721,065 7,667
Accrued expenses 1,828,523 2,185,537 23,238
Income taxes payable 133,778 156,266 1,662
Other current liabilities 984,328 941,918 10,015
Total current liabilities 11,781,574 12,912,520 137,294
Long-term liabilities
Long-term debt 6,042,277 7,337,824 78,020
Accrued pension and severance costs 708,402 766,112 8,146
Deferred income taxes 908,883 1,385,927 14,736
Other long-term liabilities 143,351 308,078 3,276
Total long-term liabilities 7,802,913 9,797,941 104,178
Shareholders’ equity
Toyota Motor Corporation shareholders’ equity
Common stock, no par value,
authorized: 10,000,000,000 shares in 2012 and 2013;
issued: 3,447,997,492 shares in 2012 and 2013 397,050 397,050 4,222
Additional paid-in capital 550,650 551,040 5,859
Retained earnings 11,917,074 12,689,206 134,920
Accumulated other comprehensive income (loss) (1,178,833) (356,123) (3,787)
Treasury stock, at cost, 281,187,739 shares in 2012 and
280,568,824 shares in 2013 (1,135,680) (1,133,138) (12,048)
Total Toyota Motor Corporation shareholders’ equity 10,550,261 12,148,035 129,166
Noncontrolling interests 516,217 624,821 6,643
Total shareholders’ equity 11,066,478 12,772,856 135,809
Commitments and contingencies
Total liabilities and shareholders’ equity ¥30,650,965 ¥35,483,317 $377,281
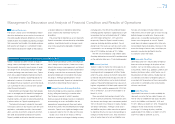
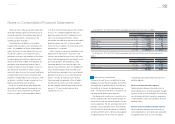
Selected Financial Summary (U.S. GAAP) Consolidated Segment Information Consolidated Quarterly Financial Summary Management’s Discussion and Analysis of Financial Condition and Results of Operations Consolidated Financial Statements [1 of 6] Notes to Consolidated Financial Statements
Management’s Annual Report on Internal Control over Financial Reporting Report of Independent Registered Public Accounting Firm