Toyota 2013 Annual Report Download - page 90
Download and view the complete annual report
Please find page 90 of the 2013 Toyota annual report below. You can navigate through the pages in the report by either clicking on the pages listed below, or by using the keyword search tool below to find specific information within the annual report.-
 1
1 -
2
-
3
-
4
-
5
-
6
-
7
-
8
-
9
-
10
-
11
-
12
-
13
-
14
-
15
-
16
-
17
-
18
-
19
-
20
-
21
-
22
-
23
-
24
-
25
-
26
-
27
-
28
-
29
-
30
-
31
-
32
-
33
-
34
-
35
-
36
-
37
-
38
-
39
-
40
-
41
-
42
-
43
-
44
-
45
-
46
-
47
-
48
-
49
-
50
-
51
-
52
-
53
-
54
-
55
-
56
-
57
-
58
-
59
-
60
-
61
-
62
-
63
-
64
-
65
-
66
-
67
-
68
-
69
-
70
-
71
-
72
-
73
-
74
-
75
-
76
-
77
-
78
-
79
-
 80
80 -
 81
81 -
 82
82 -
 83
83 -
 84
84 -
 85
85 -
 86
86 -
 87
87 -
 88
88 -
 89
89 -
 90
90 -
 91
91 -
 92
92 -
 93
93 -
 94
94 -
 95
95 -
 96
96 -
 97
97 -
 98
98 -
 99
99 -
 100
100 -
101
-
102
-
103
-
104
-
105
-
106
-
107
-
108
-
109
-
110
-
111
-
112
-
113
-
114
-
115
-
116
-
117
-
118
-
119
-
120
-
121
-
122
-
123
-
124
 |
 |

Toyota Global Vision President’s Message Launching a New Structure Special Feature Review of Operations
Consolidated Performance
Highlights
Management and
Corporate Information Investor InformationFinancial Section
Page 90
NextPrev
ContentsSearchPrint
ANNUAL REPORT 2013
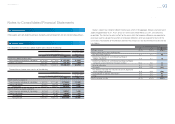
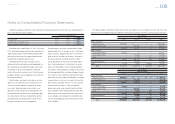
Yen in millions U.S. dollars in millions
For the years ended March 31,
For the year ended
March 31,
2011 2012 2013 2013
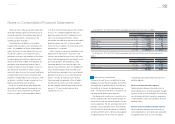
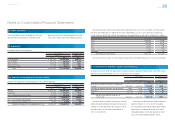
Net revenues ¥21,874,143 ¥22,211,233 ¥24,242,046 $257,757
Gross profi t ¥ 2,342,706 ¥ 2,297,660 ¥ 2,620,892 $ 27,867
Net income attributable to affi liated companies
accounted for by the equity method ¥ 641,771 ¥ 554,983 ¥ 705,249 $ 7,499
Equity in earnings of affi liated companies
attributable to Toyota Motor Corporation ¥ 215,016 ¥ 197,701 ¥ 231,519 $ 2,461
Entities comprising a signifi cant portion of Toyota’s investment in affi liated companies and percentage of
ownership are presented below:
Percentage of ownership
March 31,
Name of affi liated companies 2012 2013
Denso Corporation 24.9% 24.9%
Toyota Industries Corporation 24.8% 24.8%
Aisin Seiki Co., Ltd. 23.4% 23.4%
Toyota Tsusho Corporation 22.1% 22.1%
Toyoda Gosei Co., Ltd. 43.1% 43.0%
Certain affi liated companies accounted for by the
equity method with carrying amounts of ¥1,467,575
million and ¥1,582,988 million ($16,831 million) at
March 31, 2012 and 2013, respectively, were quot-
ed on various established markets at an aggregate
value of ¥1,477,413 million and ¥1,954,347 million
($20,780 million), respectively. Toyota evaluated its
investments in affi liated companies, considering the
length of time and the extent to which the quoted
market prices have been less than the carrying
amounts, the fi nancial condition and near-term
prospects of the affi liated companies and Toyota’s
ability and intent to retain those investments in the
companies for a period of time. Toyota did not rec-
ognize any impairment loss for the years ended
March 31, 2011, 2012 and 2013.
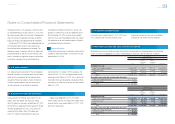
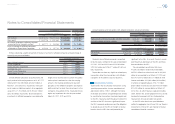
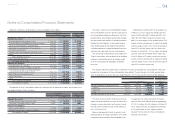
Account balances and transactions with affi liated companies are presented below:
Yen in millions U.S. dollars in millions
March 31, March 31,
2012 2013 2013
Trade accounts and notes receivable, and other receivables ¥283,497 ¥252,708 $2,687
Accounts payable and other payables 707,955 592,027 6,295
Yen in millions U.S. dollars in millions
For the years ended March 31,
For the year ended
March 31,
2011 2012 2013 2013
Net revenues ¥1,612,397 ¥1,536,326 ¥1,926,854 $20,488
Purchases 3,655,185 3,785,284 4,020,138 42,745
Dividends from affi liated companies accounted
for by the equity method for the years ended March
31, 2011, 2012 and 2013 were ¥103,169 million,
¥122,950 million and ¥126,977 million ($1,350 mil-
lion), respectively.
Toyota does not have any signifi cant related party
transactions other than transactions with affi liated
companies in the ordinary course of business.
Variable interest entities
Toyota enters into securitization transactions using
special-purpose entities, that are considered vari-
able interest entities (“VIEs”). Although the fi nance
receivables and vehicles on operating leases related
to securitization transactions have been legally sold
to the VIEs, Toyota has both the power to direct the
activities of the VIEs that most signifi cantly impact
the VIEs’ economic performance and the obligation
to absorb losses of the VIEs or the right to receive
benefi ts from the VIEs that could potentially be
signifi cant to the VIEs. As a result, Toyota is consid-
ered the primary benefi ciary of the VIEs and there-
fore consolidates the VIEs.
The consolidated securitization VIEs have
¥1,208,136 million in retail fi nance receivables,
¥65,541 million in restricted cash and ¥1,040,816
million in secured debt as of March 31, 2012 and
have ¥1,135,513 million ($12,074 million) in retail
fi nance receivables, ¥41,664 million ($443 million)
in vehicles on operating leases, ¥58,770 million
($625 million) in restricted cash and ¥978,095 million
($10,400 million) in secured debt as of March 31,
2013. Risks to which Toyota is exposed including
credit, interest rate, and/or prepayment risks are not
incremental compared with the situation before
Toyota enters into securitization transactions.
As for VIEs other than those specifi ed above,
neither the aggregate size of these VIEs nor Toyota’s
involvements in these VIEs are material to Toyota’s
consolidated fi nancial statements.
Notes to Consolidated Financial Statements
Selected Financial Summary (U.S. GAAP) Consolidated Segment Information Consolidated Quarterly Financial Summary Management’s Discussion and Analysis of Financial Condition and Results of Operations Consolidated Financial Statements Notes to Consolidated Financial Statements [13 of 44]
Management’s Annual Report on Internal Control over Financial Reporting Report of Independent Registered Public Accounting Firm