Toyota 2013 Annual Report Download - page 119
Download and view the complete annual report
Please find page 119 of the 2013 Toyota annual report below. You can navigate through the pages in the report by either clicking on the pages listed below, or by using the keyword search tool below to find specific information within the annual report.-
 1
1 -
2
-
3
-
4
-
5
-
6
-
7
-
8
-
9
-
10
-
11
-
12
-
13
-
14
-
15
-
16
-
17
-
18
-
19
-
20
-
21
-
22
-
23
-
24
-
25
-
26
-
27
-
28
-
29
-
30
-
31
-
32
-
33
-
34
-
35
-
36
-
37
-
38
-
39
-
40
-
41
-
42
-
43
-
44
-
45
-
46
-
47
-
48
-
49
-
50
-
51
-
52
-
53
-
54
-
55
-
56
-
57
-
58
-
59
-
60
-
61
-
62
-
63
-
64
-
65
-
66
-
67
-
68
-
69
-
70
-
71
-
72
-
73
-
74
-
75
-
76
-
77
-
78
-
79
-
80
-
81
-
82
-
83
-
84
-
85
-
86
-
87
-
88
-
89
-
90
-
91
-
92
-
93
-
94
-
95
-
96
-
97
-
98
-
99
-
100
-
101
-
102
-
103
-
104
-
105
-
106
-
107
-
108
-
 109
109 -
 110
110 -
 111
111 -
 112
112 -
 113
113 -
 114
114 -
 115
115 -
 116
116 -
 117
117 -
 118
118 -
 119
119 -
 120
120 -
 121
121 -
 122
122 -
 123
123 -
 124
124
 |
 |
Toyota Global Vision President’s Message Launching a New Structure Special Feature Review of Operations
Consolidated Performance
Highlights
Management and
Corporate Information Investor InformationFinancial Section
Page 119
NextPrev
ContentsSearchPrint
ANNUAL REPORT 2013
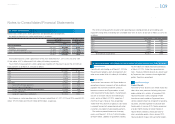
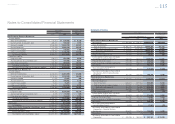
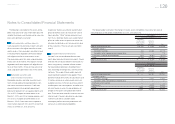
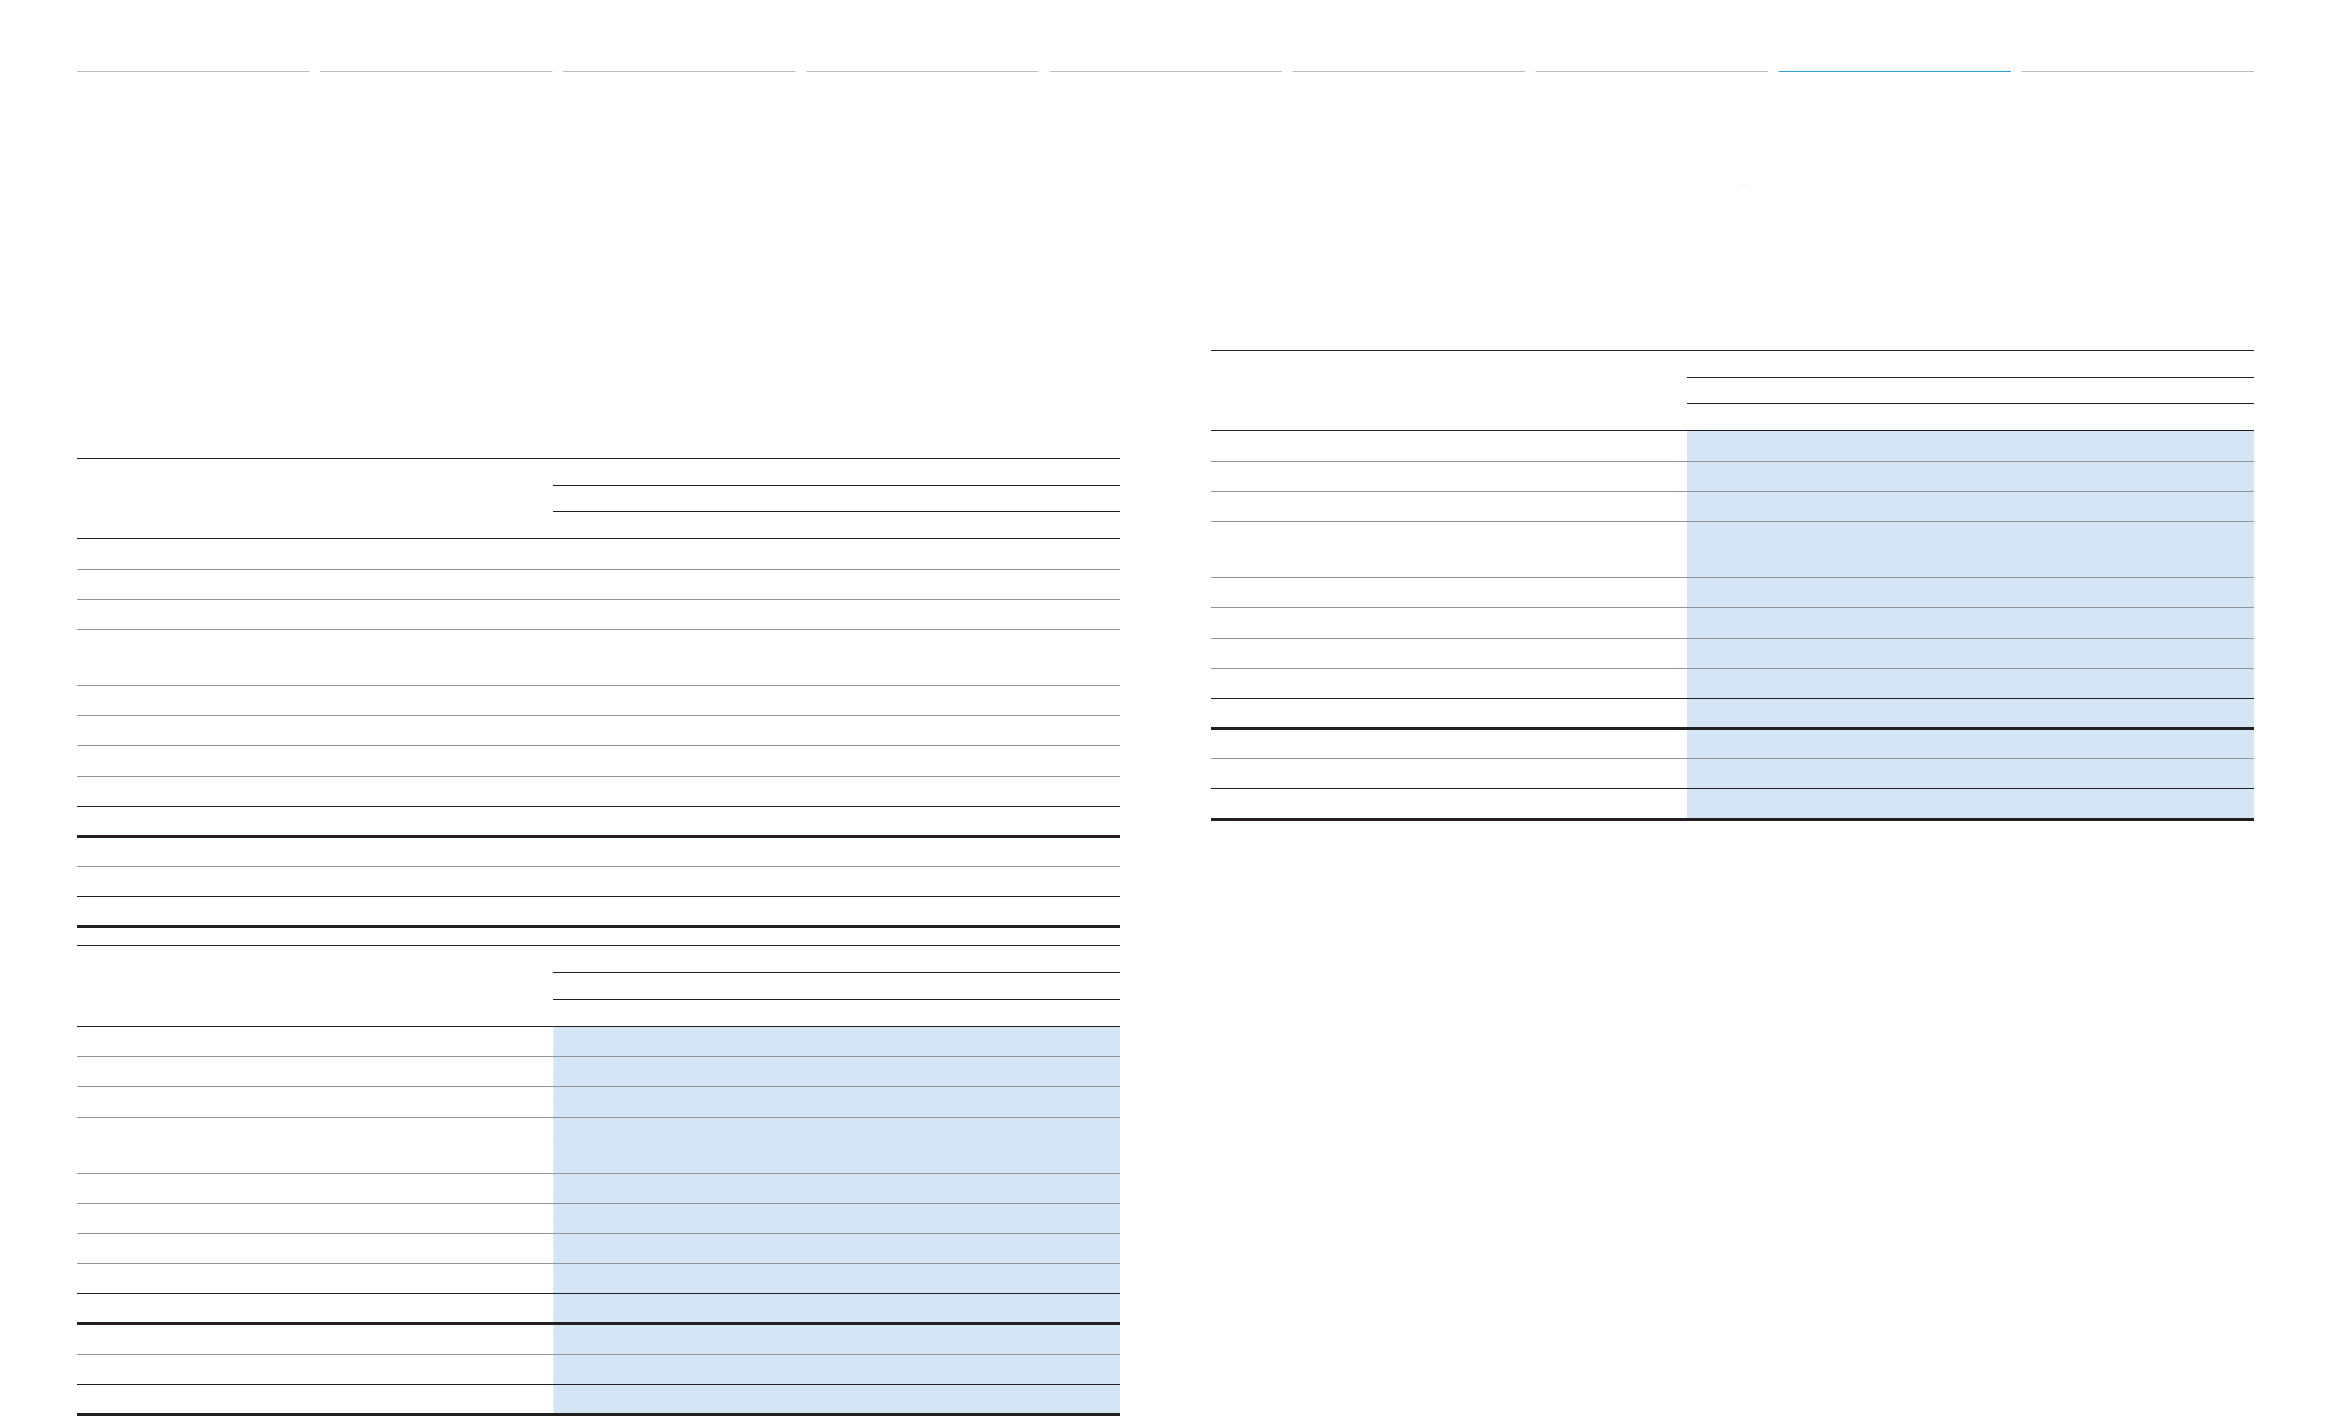
The following table summarizes the fair values of the assets and liabilities measured at fair value on a recur-
ring basis at March 31, 2012 and 2013. Transfers between levels of the fair value are recognized at the end of
their respective reporting periods:
Yen in millions
March 31, 2012
Level 1 Level 2 Level 3 Total
Assets:
Cash equivalents ¥ 485,119 ¥ 223,385 ¥ — ¥ 708,504
Time deposits — 50,000 — 50,000
Marketable securities and other
securities investments
Public and corporate bonds 3,389,882 237,934 1,684 3,629,500
Common stocks 1,034,319 — — 1,034,319
Other 40,619 428,737 — 469,356
Derivative fi nancial instruments — 289,931 7,565 297,496
Total ¥4,949,939 ¥1,229,987 ¥ 9,249 ¥6,189,175
Liabilities:
Derivative fi nancial instruments ¥ — ¥ (180,347) ¥(2,826) ¥ (183,173)
Total ¥ — ¥ (180,347) ¥(2,826) ¥ (183,173)
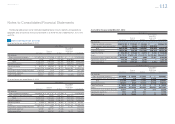
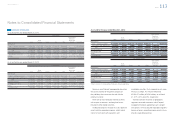
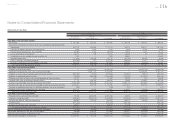
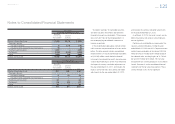
Yen in millions
March 31, 2013
Level 1 Level 2 Level 3 Total
Assets:
Cash equivalents ¥ 245,264 ¥ 375,941 ¥ — ¥ 621,205
Time deposits — 57,572 — 57,572
Marketable securities and other
securities investments
Public and corporate bonds 3,753,451 792,806 6,889 4,553,146
Common stocks 1,401,183 — — 1,401,183
Other 49,731 518,955 — 568,686
Derivative fi nancial instruments — 217,745 7,083 224,828
Total ¥5,449,629 ¥1,963,019 ¥13,972 ¥7,426,620
Liabilities:
Derivative fi nancial instruments ¥ — ¥ (196,386) ¥ (1,956) ¥ (198,342)
Total ¥ — ¥ (196,386) ¥ (1,956) ¥ (198,342)
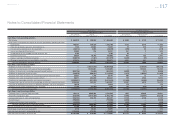
U.S. dollars in millions
March 31, 2013
Level 1 Level 2 Level 3 Total
Assets:
Cash equivalents $ 2,608 $ 3,997 $ — $ 6,605
Time deposits — 612 — 612
Marketable securities and other
securities investments
Public and corporate bonds 39,909 8,430 73 48,412
Common stocks 14,898 — — 14,898
Other 529 5,518 — 6,047
Derivative fi nancial instruments — 2,315 75 2,390
Total $57,944 $20,872 $148 $78,964
Liabilities:
Derivative fi nancial instruments $ — $ (2,088) $ (21) $ (2,109)
Total $ — $ (2,088) $ (21) $ (2,109)
Notes to Consolidated Financial Statements
Selected Financial Summary (U.S. GAAP) Consolidated Segment Information Consolidated Quarterly Financial Summary Management’s Discussion and Analysis of Financial Condition and Results of Operations Consolidated Financial Statements Notes to Consolidated Financial Statements [42 of 44]
Management’s Annual Report on Internal Control over Financial Reporting Report of Independent Registered Public Accounting Firm