Toyota 2013 Annual Report Download - page 97
Download and view the complete annual report
Please find page 97 of the 2013 Toyota annual report below. You can navigate through the pages in the report by either clicking on the pages listed below, or by using the keyword search tool below to find specific information within the annual report.-
 1
1 -
2
-
3
-
4
-
5
-
6
-
7
-
8
-
9
-
10
-
11
-
12
-
13
-
14
-
15
-
16
-
17
-
18
-
19
-
20
-
21
-
22
-
23
-
24
-
25
-
26
-
27
-
28
-
29
-
30
-
31
-
32
-
33
-
34
-
35
-
36
-
37
-
38
-
39
-
40
-
41
-
42
-
43
-
44
-
45
-
46
-
47
-
48
-
49
-
50
-
51
-
52
-
53
-
54
-
55
-
56
-
57
-
58
-
59
-
60
-
61
-
62
-
63
-
64
-
65
-
66
-
67
-
68
-
69
-
70
-
71
-
72
-
73
-
74
-
75
-
76
-
77
-
78
-
79
-
80
-
81
-
82
-
83
-
84
-
85
-
86
-
 87
87 -
 88
88 -
 89
89 -
 90
90 -
 91
91 -
 92
92 -
 93
93 -
 94
94 -
 95
95 -
 96
96 -
 97
97 -
 98
98 -
 99
99 -
 100
100 -
 101
101 -
 102
102 -
 103
103 -
 104
104 -
 105
105 -
 106
106 -
 107
107 -
108
-
109
-
110
-
111
-
112
-
113
-
114
-
115
-
116
-
117
-
118
-
119
-
120
-
121
-
122
-
123
-
124
 |
 |

Toyota Global Vision President’s Message Launching a New Structure Special Feature Review of Operations
Consolidated Performance
Highlights
Management and
Corporate Information Investor InformationFinancial Section
Page 97
NextPrev
ContentsSearchPrint
ANNUAL REPORT 2013
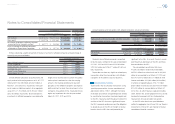
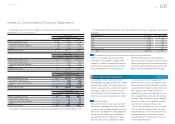
In June 1997, the parent company’s shareholders
approved a stock option plan for board members.
In June 2001, the shareholders approved an
amendment of the plan to include both board mem-
bers and key employees. Each year until June
2010, since the plans’ inception, the shareholders
have approved the authorization for the grant of
options for the purchase of Toyota’s common stock.
Authorized shares for each year that remain ungranted
are unavailable for grant in future years. Stock
options granted in and after August 2006 have
terms of 8 years and an exercise price equal to
1.025 times the closing price of Toyota’s common
stock on the date of grant. These options generally
vest 2 years from the date of grant.
For the years ended March 31, 2011, 2012 and
2013, Toyota recognized stock-based compensa-
tion expenses for stock options of ¥2,522 million,
¥1,539 million and ¥325 million ($3 million) as sell-
ing, general and administrative expenses.
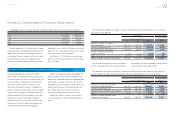
The weighted-average grant-date fair value of
options granted during the year ended March 31,
2011 was ¥724 per share. The fair value of options
granted is amortized over the option vesting period
in determining net income attributable to Toyota
Motor Corporation in the consolidated statements
of income. The grant-date fair value of options
granted is estimated using the Black-Scholes
option pricing model with the following weighted-
average assumptions:
2011
Dividend rate 1.5%
Risk-free interest rate 0.3%
Expected volatility 32%
Expected holding period (years) 5.0
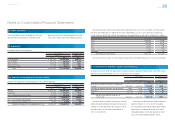
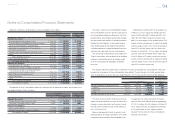
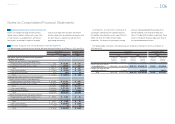
18. Stock-based compensation The following table summarizes Toyota’s stock option activity:
Yen Yen in millions
Number of
shares
Weighted-average
exercise
price
Weighted-average
remaining
contractual life
in years
Aggregate
intrinsic value
Options outstanding at March 31, 2010 13,716,700 ¥5,363 5.23 ¥ —
Granted 3,435,000 3,183
Exercised — —
Canceled (1,364,900) 4,759
Options outstanding at March 31, 2011 15,786,800 4,941 5.04 ¥ 565
Granted — —
Exercised — —
Canceled (3,256,800) 5,059
Options outstanding at March 31, 2012 12,530,000 4,910 4.55 ¥1,065
Granted — —
Exercised (645,000) 3,328
Canceled (1,036,000) 5,907
Options outstanding at March 31, 2013 10,849,000 ¥4,909 3.56 ¥5,921
Options exercisable at March 31, 2011 9,347,800 ¥5,821 3.79 ¥ —
Options exercisable at March 31, 2012 9,778,000 ¥5,396 4.05 ¥ —
Options exercisable at March 31, 2013 10,849,000 ¥4,909 3.56 ¥5,921
No options were exercised for the years ended
March 31, 2011 and 2012. The total intrinsic value
of options exercised for the year ended March 31,
2013 was ¥364 million ($4 million).
No cash was received from the exercise of stock
options for the years ended March 31, 2011 and
2012. Cash received from the exercise of stock
options for the year ended March 31, 2013 was
¥2,147 million ($23 million).
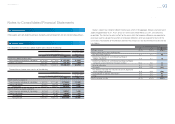
The following table summarizes information for options outstanding and options exercisable at March 31, 2013:
Outstanding Exercisable
Exercise price
range Number of
shares
Weighted-average
exercise price
Weighted-
average
remaining life Number of
shares
Weighted-average
exercise price
Yen Yen U.S. dollars Years Yen U.S. dollars
¥3,183 – 5,000 7,480,000 ¥4,068 $43 4.31 7,480,000 ¥4,068 $43
5,001 – 7,278 3,369,000 6,774 72 1.89 3,369,000 6,774 72
3,183 – 7,278 10,849,000 4,909 52 3.56 10,849,000 4,909 52
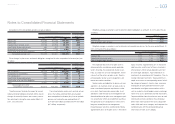
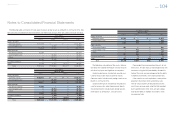
Notes to Consolidated Financial Statements
Selected Financial Summary (U.S. GAAP) Consolidated Segment Information Consolidated Quarterly Financial Summary Management’s Discussion and Analysis of Financial Condition and Results of Operations Consolidated Financial Statements Notes to Consolidated Financial Statements [20 of 44]
Management’s Annual Report on Internal Control over Financial Reporting Report of Independent Registered Public Accounting Firm