Toyota 2013 Annual Report Download - page 63
Download and view the complete annual report
Please find page 63 of the 2013 Toyota annual report below. You can navigate through the pages in the report by either clicking on the pages listed below, or by using the keyword search tool below to find specific information within the annual report.-
 1
1 -
2
-
3
-
4
-
5
-
6
-
7
-
8
-
9
-
10
-
11
-
12
-
13
-
14
-
15
-
16
-
17
-
18
-
19
-
20
-
21
-
22
-
23
-
24
-
25
-
26
-
27
-
28
-
29
-
30
-
31
-
32
-
33
-
34
-
35
-
36
-
37
-
38
-
39
-
40
-
41
-
42
-
43
-
44
-
45
-
46
-
47
-
48
-
49
-
50
-
51
-
52
-
 53
53 -
 54
54 -
 55
55 -
 56
56 -
 57
57 -
 58
58 -
 59
59 -
 60
60 -
 61
61 -
 62
62 -
 63
63 -
 64
64 -
 65
65 -
 66
66 -
 67
67 -
 68
68 -
 69
69 -
 70
70 -
 71
71 -
 72
72 -
 73
73 -
74
-
75
-
76
-
77
-
78
-
79
-
80
-
81
-
82
-
83
-
84
-
85
-
86
-
87
-
88
-
89
-
90
-
91
-
92
-
93
-
94
-
95
-
96
-
97
-
98
-
99
-
100
-
101
-
102
-
103
-
104
-
105
-
106
-
107
-
108
-
109
-
110
-
111
-
112
-
113
-
114
-
115
-
116
-
117
-
118
-
119
-
120
-
121
-
122
-
123
-
124
 |
 |

Toyota Global Vision President’s Message Launching a New Structure Special Feature Review of Operations
Consolidated Performance
Highlights
Management and
Corporate Information Investor InformationFinancial Section
Page 63
NextPrev
ContentsSearchPrint
ANNUAL REPORT 2013
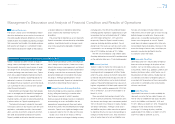
As for our world future business environment, the
U.S. economy is expected to benefi t from ongoing
moderate recovery and a pickup in the pace of eco-
nomic expansion in emerging countries. Europe,
meanwhile, still faces the risk of economic stagna-
tion due to the sovereign debt crisis and other fac-
tors, though a gradual bottoming out is anticipated.
The automotive market is expected to see recov-
ery in the U.S. and expansion in emerging countries.
However, amid the change in market structure, as
seen in the expansion and diversifi cation of demand
for eco-cars backed by rising environmental con-
sciousness, fi erce competition exists on a global
scale. With the foregoing external factors in mind,
Toyota expects that net revenues for fi scal 2014 will
increase compared with fi scal 2013 as results of a
favorable impact of fl uctuations in foreign currency
translation rates and an increase in vehicle unit
sales. With respect to operating income, factors
expected to contribute to an increase in operating
income include the favorable impact of fl uctuations
in foreign currency rates, increased vehicle unit
sales through marketing efforts, and cost reduction
efforts. On the other hand, factors expected to con-
tribute to a decrease in operating income include
increase in miscellaneous costs and others. As the
Outlook
Historically, Toyota has funded its capital expenditures and research and development activities through cash
generated by operations.
Liquidity and Capital Resources
result, Toyota expects that operating income will
increase in fi scal 2014 compared with fi scal 2013.
Also, Toyota expects that income before income
taxes and equity in earnings of affi liated companies
and net income attributable to Toyota Motor
Corporation will increase in fi scal 2014.
For the purposes of this outlook discussion,
Toyota is assuming an average exchange rate of
¥90 to the U.S. dollar and ¥120 to the euro.
Exchange rate fl uctuations can materially affect
Toyota’s operating results. In particular, a strength-
ening of the Japanese yen against the U.S. dollar
can have a material adverse effect on Toyota’s
operating results. See “Overview—Currency
Fluctuations” for further discussion.
The foregoing statements are forward-looking
statements based upon Toyota’s management’s
assumptions and beliefs regarding exchange rates,
market demand for Toyota’s products, economic
conditions and others. See “Cautionary Statement
Concerning Forward-Looking Statements”. Toyota’s
actual results of operations could vary signifi cantly
from those described above as a result of unantici-
pated changes in the factors described above or
other factors, including those described in
“Risk Factors”.
3,000
0
2,000
2,500
1,500
500
1,000
1,500
0
1,200
900
600
300
2,500
0
2,000
1,500
1,000
500
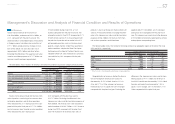
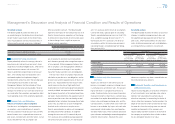
Net Cash Provided by
Operating Activities and
Free Cash Flow*
* (Net cash provided by operating activities)-
(Capital expenditures for property, plant and
equipment, excluding vehicles and
equipment on operating leases)
왎왎 Net cash provided by operating activities
왎왎 Free cash flow
(¥ Billion)
FY ’09 ’10 ’11 ’12 ’13
Capital Expenditures for
Property, Plant and Equipment*
and Depreciation
* Excluding vehicles and equipment on operating leases
왎왎 Capital expenditures 왎왎 Depreciation
(¥ Billion)
FY ’09 ’10 ’11 ’12 ’13
Cash and Cash Equivalents
at End of Year
(¥ Billion)
FY ’09 ’10 ’11 ’12 ’13
Management’s Discussion and Analysis of Financial Condition and Results of Operations
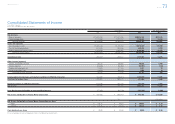
Operating income from fi nancial services opera-
tions decreased by ¥51.8 billion, or 14.5%, to
¥306.4 billion during fi scal 2012 compared with the
prior fi scal year. This decrease was due primarily to
the recording of ¥20.8 billion of valuation losses on
interest rate swaps stated at fair value.
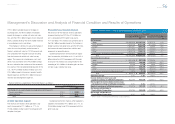
Ratio of credit loss experience in the United States is as follows:
Years ended March 31,
2011 2012
Net charge-offs as a percentage of average gross earning assets:
Finance receivables 0.61% 0.24%
Operating lease 0.22 0.11
Total 0.52% 0.21%
All Other Operations Segment
Net revenues for Toyota’s other operations seg-
ments increased by ¥76.6 billion, or 7.9%, to
¥1,048.9 billion during fi
scal 2012 compared with
the prior fi scal year.
Operating income from Toyota’s other operations
segments increased by ¥6.8 billion, or 19.4%, to
¥42.0 billion during fi scal 2012 compared with the
prior fi scal year.
Selected Financial Summary (U.S. GAAP) Consolidated Segment Information Consolidated Quarterly Financial Summary Management’s Discussion and Analysis of Financial Condition and Results of Operations [18 of 26] Consolidated Financial Statements Notes to Consolidated Financial Statements
Management’s Annual Report on Internal Control over Financial Reporting Report of Independent Registered Public Accounting Firm