Toyota 2013 Annual Report Download - page 43
Download and view the complete annual report
Please find page 43 of the 2013 Toyota annual report below. You can navigate through the pages in the report by either clicking on the pages listed below, or by using the keyword search tool below to find specific information within the annual report.-
 1
1 -
2
-
3
-
4
-
5
-
6
-
7
-
8
-
9
-
10
-
11
-
12
-
13
-
14
-
15
-
16
-
17
-
18
-
19
-
20
-
21
-
22
-
23
-
24
-
25
-
26
-
27
-
28
-
29
-
30
-
31
-
32
-
 33
33 -
 34
34 -
 35
35 -
 36
36 -
 37
37 -
 38
38 -
 39
39 -
 40
40 -
 41
41 -
 42
42 -
 43
43 -
 44
44 -
 45
45 -
 46
46 -
 47
47 -
 48
48 -
 49
49 -
 50
50 -
 51
51 -
 52
52 -
 53
53 -
54
-
55
-
56
-
57
-
58
-
59
-
60
-
61
-
62
-
63
-
64
-
65
-
66
-
67
-
68
-
69
-
70
-
71
-
72
-
73
-
74
-
75
-
76
-
77
-
78
-
79
-
80
-
81
-
82
-
83
-
84
-
85
-
86
-
87
-
88
-
89
-
90
-
91
-
92
-
93
-
94
-
95
-
96
-
97
-
98
-
99
-
100
-
101
-
102
-
103
-
104
-
105
-
106
-
107
-
108
-
109
-
110
-
111
-
112
-
113
-
114
-
115
-
116
-
117
-
118
-
119
-
120
-
121
-
122
-
123
-
124
 |
 |
Toyota Global Vision President’s Message Launching a New Structure Special Feature Review of Operations
Consolidated Performance
Highlights
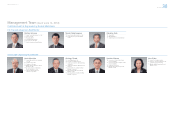
Management and
Corporate Information Investor InformationFinancial Section
Page 43
NextPrev
ContentsSearchPrint
ANNUAL REPORT 2013
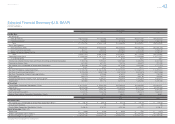
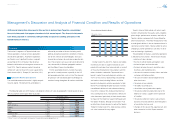
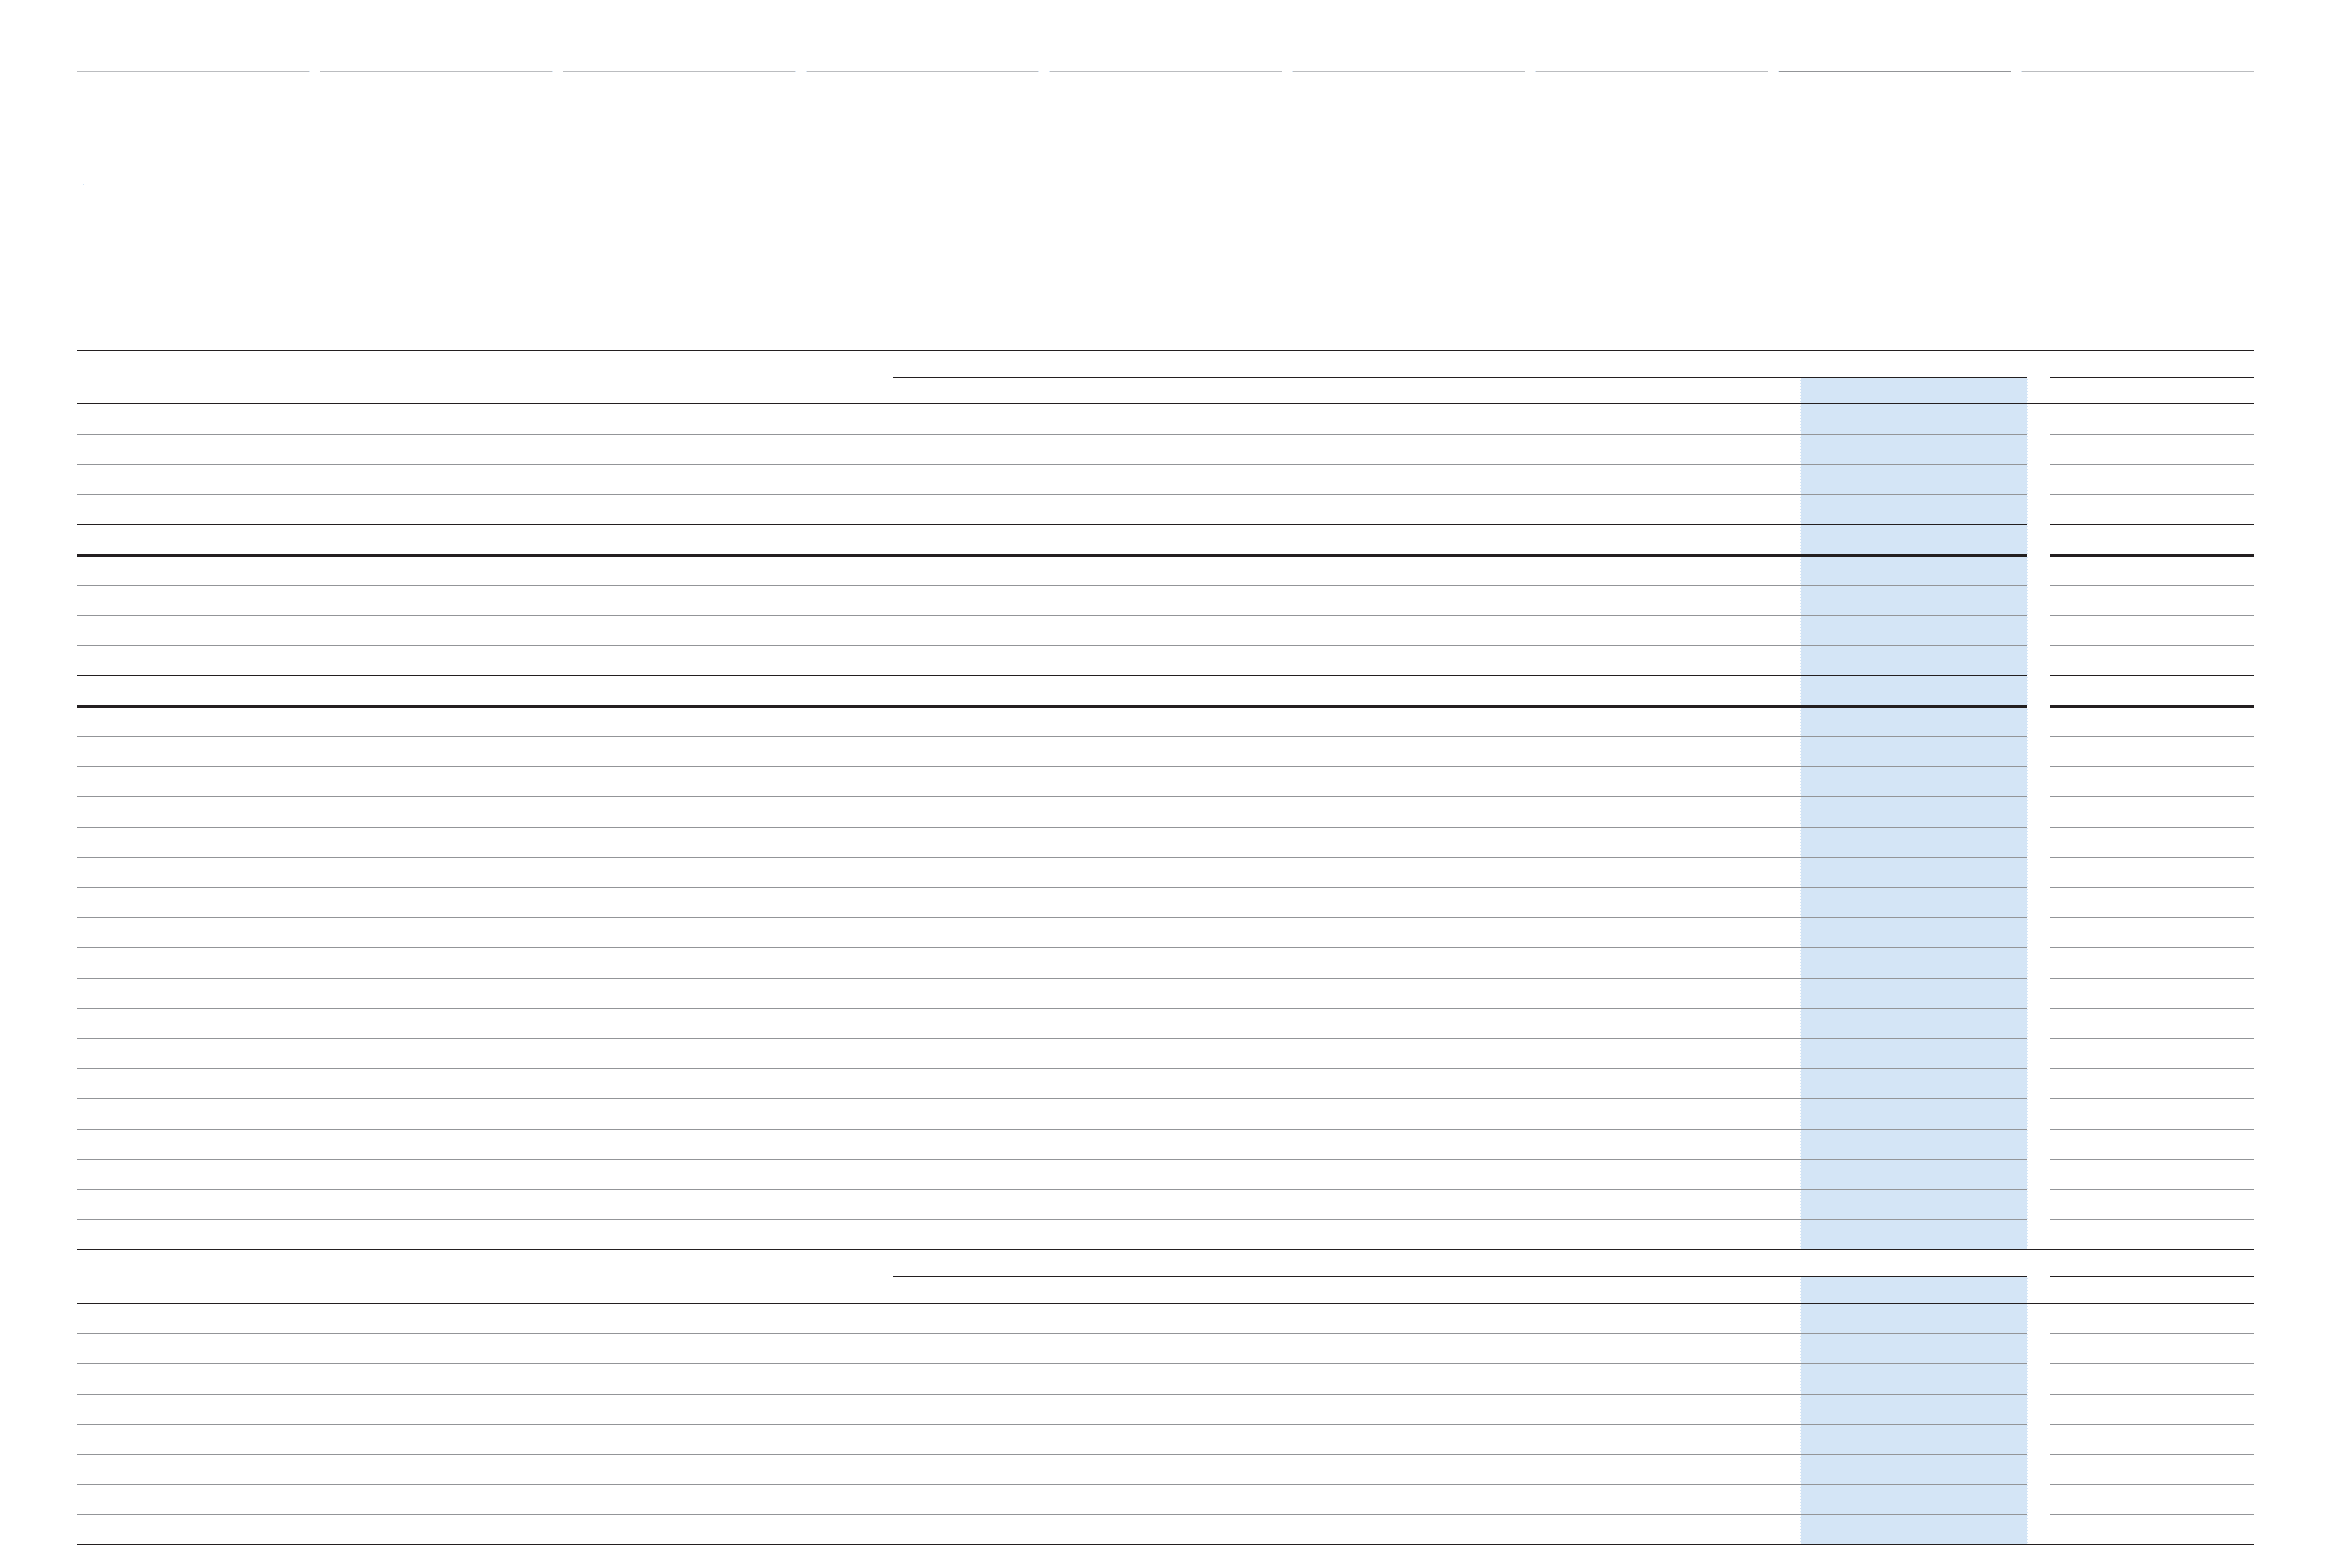
Yen in millions % change
2009 2010 2011 2012 2013 2013 vs. 2012
For the Year:
Net Revenues:
Sales of Products ¥19,173,720 ¥17,724,729 ¥17,820,520 ¥17,511,916 ¥20,914,150 +19.4
Financing Operations 1,355,850 1,226,244 1,173,168 1,071,737 1,150,042 +7.3
Total ¥20,529,570 ¥18,950,973 ¥18,993,688 ¥18,583,653 ¥22,064,192 +18.7
Costs and Expenses:
Cost of Products Sold ¥17,468,416 ¥15,971,496 ¥15,985,783 ¥15,795,918 ¥18,010,569 +14.0
Cost of Financing Operations 987,384 712,301 629,543 592,646 630,426 +6.4
Selling, General and Administrative 2,534,781 2,119,660 1,910,083 1,839,462 2,102,309 +14.3
Total ¥20,990,581 ¥18,803,457 ¥18,525,409 ¥18,228,026 ¥20,743,304 +13.8
Operating Income (Loss) ¥ (461,011) ¥ 147,516 ¥ 468,279 ¥ 355,627 ¥ 1,320,888 +271.4
% of Net Revenues -2.2% 0.8% 2.5% 1.9% 6.0% —
Income (Loss) before Income Taxes and Equity in Earnings of Affi liated Companies (560,381) 291,468 563,290 432,873 1,403,649 +224.3
Provision for Income Taxes (56,442) 92,664 312,821 262,272 551,686 +110.3
Net Income (Loss) Attributable to Toyota Motor Corporation (436,937) 209,456 408,183 283,559 962,163 +239.3
ROE -4.0% 2.1% 3.9% 2.7% 8.5% —
Net Cash Provided by Operating Activities ¥ 1,476,905 ¥ 2,558,530 ¥ 2,024,009 ¥ 1,452,435 ¥ 2,451,316 +68.8
Net Cash Used in Investing Activities (1,230,220) (2,850,184) (2,116,344) (1,442,658) (3,027,312) —
Net Cash Provided by (Used in) Financing Activities 698,841 (277,982) 434,327 (355,347) 477,242 —
R&D Expenses 904,075 725,345 730,340 779,806 807,454 +3.5
Capital Expenditures for Property, Plant and Equipment* 1,364,582 604,536 629,326 723,537 854,561 +18.1
Depreciation 1,495,170 1,414,569 1,175,573 1,067,830 1,105,109 +3.5
At Year-End:
Toyota Motor Corporation Shareholders’ Equity ¥10,061,207 ¥10,359,723 ¥10,332,371 ¥10,550,261 ¥12,148,035 +15.1
Total Assets 29,062,037 30,349,287 29,818,166 30,650,965 35,483,317 +15.8
Long-Term Debt 6,301,469 7,015,409 6,449,220 6,042,277 7,337,824 +21.4
Cash and Cash Equivalents 2,444,280 1,865,746 2,080,709 1,679,200 1,718,297 +2.3
Ratio of Toyota Motor Corporation Shareholders’ Equity 34.6% 34.1% 34.7% 34.4% 34.2% —
Yen % change
2009 2010 2011 2012 2013 2013 vs. 2012
Per Share Data:
Net Income (Loss) Attributable to Toyota Motor Corporation (Basic) ¥ (139.13) ¥ 66.79 ¥ 130.17 ¥ 90.21 ¥ 303.82 +236.8
Annual Cash Dividends 100 45 50 50 90 +80.0
Toyota Motor Corporation Shareholders’ Equity 3,208.41 3,303.49 3,295.08 3,331.51 3,835.30 +15.1
Stock Information (March 31):
Stock Price ¥ 3,120 ¥ 3,745 ¥ 3,350 ¥ 3,570 ¥ 4,860 +36.1
Market Capitalization (Yen in millions) ¥10,757,752 ¥12,912,751 ¥11,550,792 ¥12,309,351 ¥16,757,268 +36.1
Number of Shares Issued (shares) 3,447,997,492 3,447,997,492 3,447,997,492 3,447,997,492 3,447,997,492 —
* Excluding vehicles and equipment of operating leases
Selected Financial Summary (U.S. GAAP)
Toyota Motor Corporation
Fiscal years ended March 31
Selected Financial Summary (U.S. GAAP) [2 of 2] Consolidated Segment Information Consolidated Quarterly Financial Summary Management’s Discussion and Analysis of Financial Condition and Results of Operations Consolidated Financial Statements Notes to Consolidated Financial Statements
Management’s Annual Report on Internal Control over Financial Reporting Report of Independent Registered Public Accounting Firm