Toyota 2013 Annual Report Download - page 101
Download and view the complete annual report
Please find page 101 of the 2013 Toyota annual report below. You can navigate through the pages in the report by either clicking on the pages listed below, or by using the keyword search tool below to find specific information within the annual report.-
 1
1 -
2
-
3
-
4
-
5
-
6
-
7
-
8
-
9
-
10
-
11
-
12
-
13
-
14
-
15
-
16
-
17
-
18
-
19
-
20
-
21
-
22
-
23
-
24
-
25
-
26
-
27
-
28
-
29
-
30
-
31
-
32
-
33
-
34
-
35
-
36
-
37
-
38
-
39
-
40
-
41
-
42
-
43
-
44
-
45
-
46
-
47
-
48
-
49
-
50
-
51
-
52
-
53
-
54
-
55
-
56
-
57
-
58
-
59
-
60
-
61
-
62
-
63
-
64
-
65
-
66
-
67
-
68
-
69
-
70
-
71
-
72
-
73
-
74
-
75
-
76
-
77
-
78
-
79
-
80
-
81
-
82
-
83
-
84
-
85
-
86
-
87
-
88
-
89
-
90
-
 91
91 -
 92
92 -
 93
93 -
 94
94 -
 95
95 -
 96
96 -
 97
97 -
 98
98 -
 99
99 -
 100
100 -
 101
101 -
 102
102 -
 103
103 -
 104
104 -
 105
105 -
 106
106 -
 107
107 -
 108
108 -
 109
109 -
 110
110 -
 111
111 -
112
-
113
-
114
-
115
-
116
-
117
-
118
-
119
-
120
-
121
-
122
-
123
-
124
 |
 |
Toyota Global Vision President’s Message Launching a New Structure Special Feature Review of Operations
Consolidated Performance
Highlights
Management and
Corporate Information Investor InformationFinancial Section
Page 101
NextPrev
ContentsSearchPrint
ANNUAL REPORT 2013
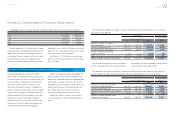
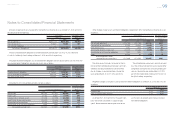
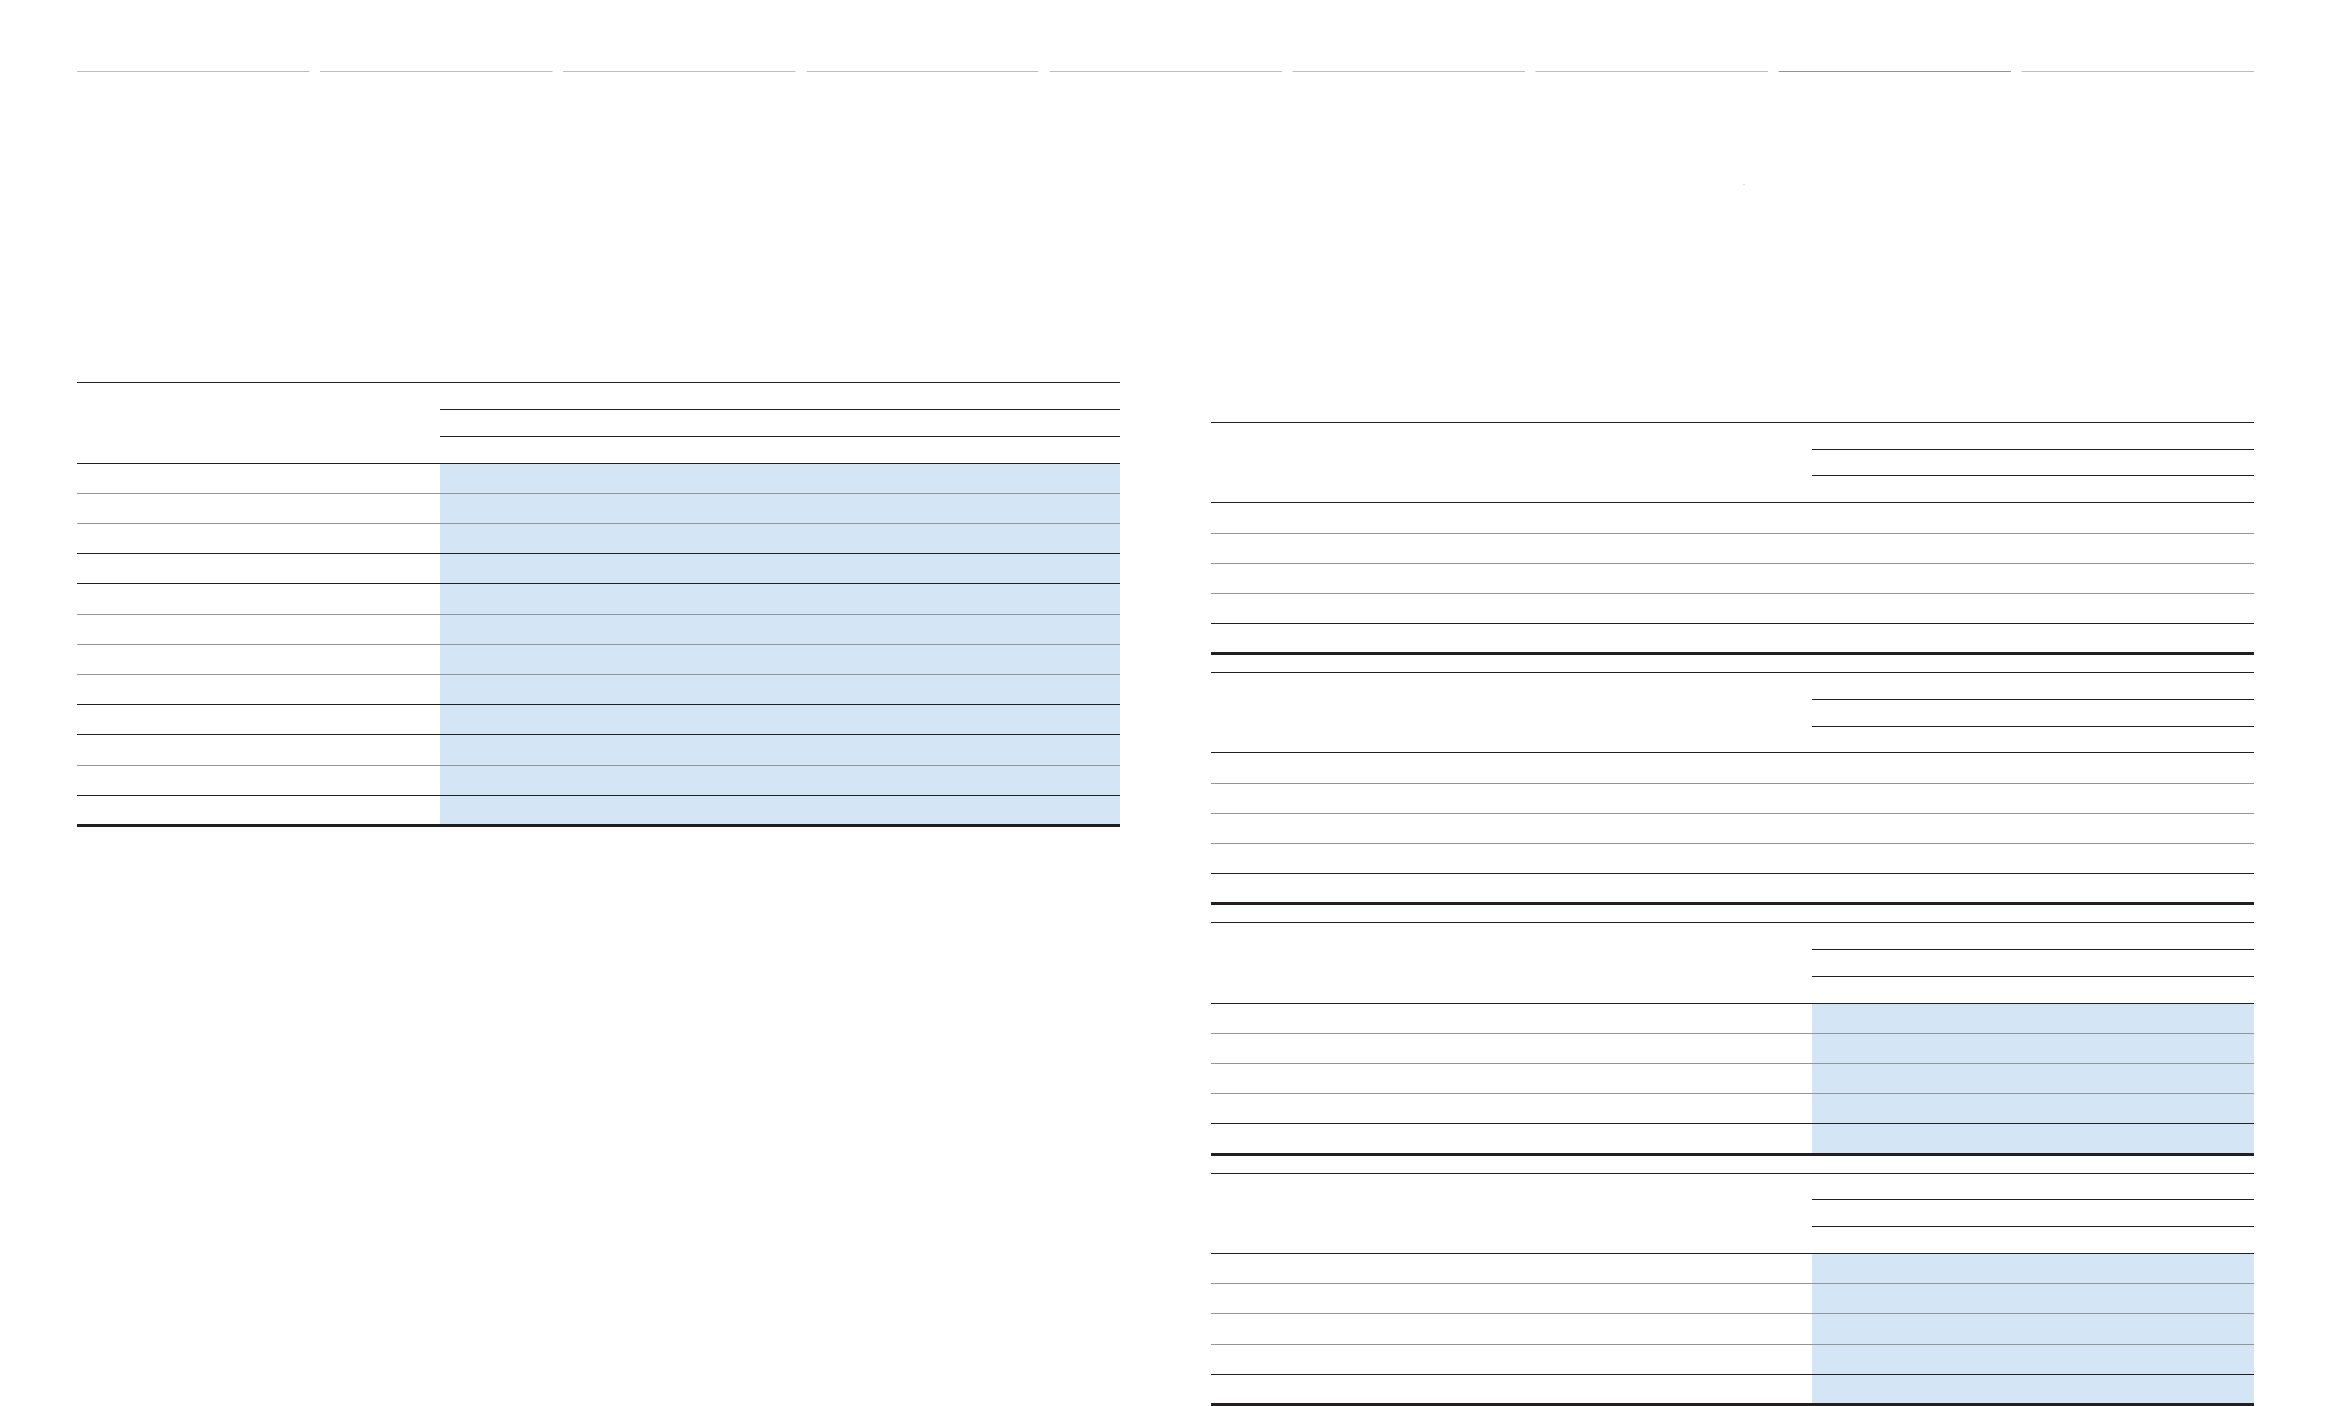
U.S. dollars in millions
March 31, 2013
Level 1 Level 2 Level 3 Total
Equity securities:
Common stocks $4,689 $ — $ — $ 4,689
Commingled funds — 1,966 — 1,966
4,689 1,966 — 6,655
Debt securities:
Government bonds 870 — — 870
Commingled funds — 2,168 — 2,168
Other — 251 5 256
870 2,419 5 3,294
Insurance contracts — 971 — 971
Other 189 42 441 672
Total $5,748 $5,398 $446 $11,592
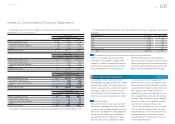
The following is description of the assets, infor-
mation about the valuation techniques used to mea-
sure fair value, key inputs and signifi cant
assumptions:
Quoted market prices for identical securities are
used to measure fair value of common stocks.
Common stocks include 69% of Japanese stocks
and 31% of foreign stocks as of March 31, 2012,
and 71% of Japanese stocks and 29% of foreign
stocks as of March 31, 2013.
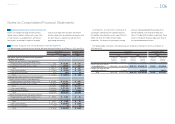
Quoted market prices for identical securities are
used to measure fair value of government bonds.
Government bonds include 35% of Japanese gov-
ernment bonds and 65% of foreign government
bonds as of March 31, 2012, and 44% of Japanese
government bonds and 56% of foreign government
bonds as of March 31, 2013.
Commingled funds are benefi cial interests of col-
lective trust. The fair values of commingled funds
are measured using the net asset value (“NAV”) pro-
vided by the administrator of the fund, and are cate-
gorized by the ability to redeem investments at the
measurement day.
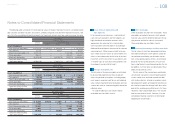
The fair values of insurance contracts are measured
using contracted amount with accrued interest.
Other consists of cash equivalents, other private
placement investment funds and other assets. The
fair values of other private placement investment
funds are measured using the NAV provided by the
administrator of the fund, and are categorized by
the ability to redeem investments at the measure-
ment day.
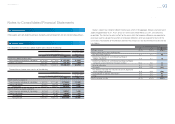
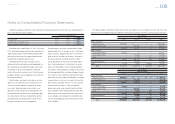
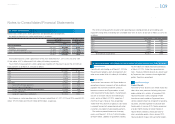
The following tables summarize the changes in Level 3 plan assets measured at fair value for the years
ended March 31, 2011, 2012 and 2013:
Yen in millions
For the year ended March 31, 2011
Debt securities Other Total
Balance at beginning of year ¥928 ¥37,421 ¥38,349
Actual return on plan assets 7 934 941
Purchases, sales and settlements (189) 19 (170)
Other — — —
Balance at end of year ¥746 ¥38,374 ¥39,120
Yen in millions
For the year ended March 31, 2012
Debt securities Other Total
Balance at beginning of year ¥746 ¥38,374 ¥39,120
Actual return on plan assets 5 (1,762) (1,757)
Purchases, sales and settlements (160) 3,453 3,293
Other — — —
Balance at end of year ¥591 ¥40,065 ¥40,656
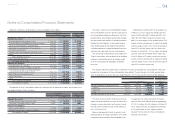
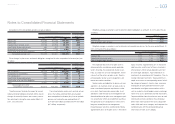
Yen in millions
For the year ended March 31, 2013
Debt securities Other Total
Balance at beginning of year ¥591 ¥40,065 ¥40,656
Actual return on plan assets 3 438 441
Purchases, sales and settlements (153) 1,032 879
Other ———
Balance at end of year ¥441 ¥41,535 ¥41,976
U.S. dollars in millions
For the year ended March 31, 2013
Debt securities Other Total
Balance at beginning of year $ 6 $426 $432
Actual return on plan assets 044
Purchases, sales and settlements (1) 11 10
Other ———
Balance at end of year $ 5 $441 $446
Toyota expects to contribute ¥54,094 million ($575 million) to its pension plans in the year ending March 31, 2014.
Notes to Consolidated Financial Statements
Selected Financial Summary (U.S. GAAP) Consolidated Segment Information Consolidated Quarterly Financial Summary Management’s Discussion and Analysis of Financial Condition and Results of Operations Consolidated Financial Statements Notes to Consolidated Financial Statements [24 of 44]
Management’s Annual Report on Internal Control over Financial Reporting Report of Independent Registered Public Accounting Firm