Toyota 2013 Annual Report Download - page 100
Download and view the complete annual report
Please find page 100 of the 2013 Toyota annual report below. You can navigate through the pages in the report by either clicking on the pages listed below, or by using the keyword search tool below to find specific information within the annual report.-
 1
1 -
2
-
3
-
4
-
5
-
6
-
7
-
8
-
9
-
10
-
11
-
12
-
13
-
14
-
15
-
16
-
17
-
18
-
19
-
20
-
21
-
22
-
23
-
24
-
25
-
26
-
27
-
28
-
29
-
30
-
31
-
32
-
33
-
34
-
35
-
36
-
37
-
38
-
39
-
40
-
41
-
42
-
43
-
44
-
45
-
46
-
47
-
48
-
49
-
50
-
51
-
52
-
53
-
54
-
55
-
56
-
57
-
58
-
59
-
60
-
61
-
62
-
63
-
64
-
65
-
66
-
67
-
68
-
69
-
70
-
71
-
72
-
73
-
74
-
75
-
76
-
77
-
78
-
79
-
80
-
81
-
82
-
83
-
84
-
85
-
86
-
87
-
88
-
89
-
 90
90 -
 91
91 -
 92
92 -
 93
93 -
 94
94 -
 95
95 -
 96
96 -
 97
97 -
 98
98 -
 99
99 -
 100
100 -
 101
101 -
 102
102 -
 103
103 -
 104
104 -
 105
105 -
 106
106 -
 107
107 -
 108
108 -
 109
109 -
 110
110 -
111
-
112
-
113
-
114
-
115
-
116
-
117
-
118
-
119
-
120
-
121
-
122
-
123
-
124
 |
 |

Toyota Global Vision President’s Message Launching a New Structure Special Feature Review of Operations
Consolidated Performance
Highlights
Management and
Corporate Information Investor InformationFinancial Section
Page 100
NextPrev
ContentsSearchPrint
ANNUAL REPORT 2013
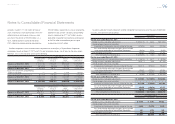
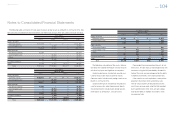
Weighted-average assumptions used to determine net periodic pension cost for the years ended March 31,
2011, 2012 and 2013 are as follows:
For the years ended March 31,
2011 2012 2013
Discount rate 2.3% 2.3% 2.0%
Expected return on plan assets 2.3% 2.5% 2.5%
Rate of compensation increase 2.3% 2.3% 2.3%
During the years ended March 31, 2011, 2012 and
2013, the parent company and certain subsidiaries in
Japan employ “point” based retirement benefi t plans
and do not use the rates of compensation increase
to determine net periodic pension cost.
The expected rate of return on plan assets is
determined after considering several applicable fac-
tors including, the composition of plan assets held,
assumed risks of asset management, historical
results of the returns on plan assets, Toyota’s princi-
pal policy for plan asset management, and forecast-
ed market conditions.
Toyota’s policy and objective for plan asset man-
agement is to maximize returns on plan assets to
meet future benefi t payment requirements under
risks which Toyota considers permissible. Asset
allocations under the plan asset management are
determined based on plan asset management poli-
cies of each plan which are established to achieve
the optimized asset compositions in terms of the
long-term overall plan asset management.
Excepting equity securities contributed by Toyota,
approximately 50% of the plan assets is invested in
equity securities, approximately 30% is invested in
debt securities, and the rest of them is invested in
insurance contracts and other products. When
actual allocations are not in line with target alloca-
tions, Toyota rebalances its investments in accor-
dance with the policies. Prior to making individual
investments, Toyota performs in-depth assessments
of corresponding factors including category of prod-
ucts, industry type, currencies and liquidity of each
potential investment under consideration to mitigate
concentrations of risks such as market risk and for-
eign currency exchange rate risk. To assess perfor-
mance of the investments, Toyota establishes
bench mark return rates for each individual invest-
ment, combines these individual bench mark rates
based on the asset composition ratios within each
asset category, and compares the combined rates
with the corresponding actual return rates on each
asset category.
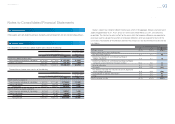
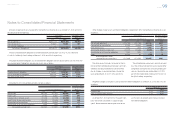
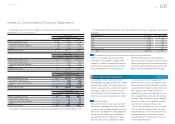
The following table summarizes the fair value of classes of plan assets as of March 31, 2012 and 2013. See
note 26 to the consolidated fi nancial statements for three levels of input which are used to measure fair value.
Yen in millions
March 31, 2012
Level 1 Level 2 Level 3 Total
Equity securities:
Common stocks ¥353,282 ¥ — ¥ — ¥353,282
Commingled funds — 158,027 — 158,027
353,282 158,027 — 511,309
Debt securities:
Government bonds 63,327 — — 63,327
Commingled funds — 176,596 — 176,596
Other — 20,155 591 20,746
63,327 196,751 591 260,669
Insurance contracts — 83,993 — 83,993
Other 27,006 4,503 40,065 71,574
Total ¥443,615 ¥443,274 ¥40,656 ¥927,545
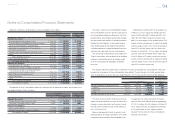
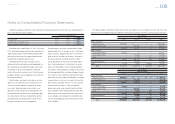
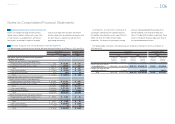
Yen in millions
March 31, 2013
Level 1 Level 2 Level 3 Total
Equity securities:
Common stocks ¥440,971 ¥ — ¥ — ¥ 440,971
Commingled funds — 184,879 — 184,879
440,971 184,879 — 625,850
Debt securities:
Government bonds 81,867 — — 81,867
Commingled funds — 203,933 — 203,933
Other — 23,594 441 24,035
81,867 227,527 441 309,835
Insurance contracts — 91,326 — 91,326
Other 17,789 3,923 41,535 63,247
Total ¥540,627 ¥507,655 ¥41,976 ¥1,090,258
Notes to Consolidated Financial Statements
Selected Financial Summary (U.S. GAAP) Consolidated Segment Information Consolidated Quarterly Financial Summary Management’s Discussion and Analysis of Financial Condition and Results of Operations Consolidated Financial Statements Notes to Consolidated Financial Statements [23 of 44]
Management’s Annual Report on Internal Control over Financial Reporting Report of Independent Registered Public Accounting Firm