TCF Bank 2012 Annual Report Download - page 89
Download and view the complete annual report
Please find page 89 of the 2012 TCF Bank annual report below. You can navigate through the pages in the report by either clicking on the pages listed below, or by using the keyword search tool below to find specific information within the annual report.-
 1
1 -
2
-
3
-
4
-
5
-
6
-
7
-
8
-
9
-
10
-
11
-
12
-
13
-
14
-
15
-
16
-
17
-
18
-
19
-
20
-
21
-
22
-
23
-
24
-
25
-
26
-
27
-
28
-
29
-
30
-
31
-
32
-
33
-
34
-
35
-
36
-
37
-
38
-
39
-
40
-
41
-
42
-
43
-
44
-
45
-
46
-
47
-
48
-
49
-
50
-
51
-
52
-
53
-
54
-
55
-
56
-
57
-
58
-
59
-
60
-
61
-
62
-
63
-
64
-
65
-
66
-
67
-
68
-
69
-
70
-
71
-
72
-
73
-
74
-
75
-
76
-
77
-
78
-
 79
79 -
 80
80 -
 81
81 -
 82
82 -
 83
83 -
 84
84 -
 85
85 -
 86
86 -
 87
87 -
 88
88 -
 89
89 -
 90
90 -
 91
91 -
 92
92 -
 93
93 -
 94
94 -
 95
95 -
 96
96 -
 97
97 -
 98
98 -
 99
99 -
100
-
101
-
102
-
103
-
104
-
105
-
106
-
107
-
108
-
109
-
110
-
111
-
112
-
113
-
114
-
115
-
116
-
117
-
118
-
119
-
120
-
121
-
122
-
123
-
124
-
125
-
126
-
127
-
128
-
129
-
130
-
131
-
132
-
133
-
134
-
135
-
136
-
137
-
138
-
139
-
140
-
141
-
142
 |
 |

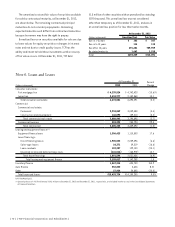
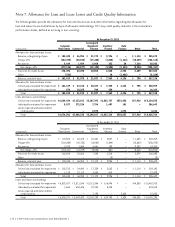
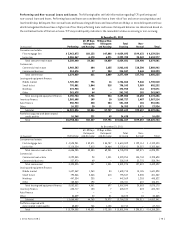
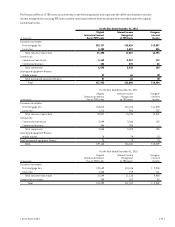
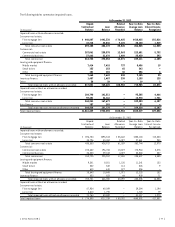
Performing and Non-accrual Loans and Leases The following tables set forth information regarding TCF’s performing and
non-accrual loans and leases. Performing loans and leases are considered to have a lower risk of loss and are on accruing status and
less than 60 days delinquent. Non-accrual loans and leases along with loans and leases that are 60 days or more delinquent are those
which management believes have a higher risk of loss than performing loans and leases. Delinquent balances are determined based on
the contractual terms of the loan or lease. TCF’s key credit quality indicator is the receivable’s status as accruing or non-accruing.
At December 31, 2012
(In thousands) Performing
60-89 Days
Delinquent
and Accruing
90 Days or More
Delinquent
and Accruing
Total
Accruing
Non-
Accrual Total
Consumer real estate:
First mortgage lien $ 3,963,873 $28,132 $47,888 $ 4,039,893 $199,631 $ 4,239,524
Junior lien 2,386,567 6,170 6,971 2,399,708 35,269 2,434,977
Total consumer real estate 6,350,440 34,302 54,859 6,439,601 234,900 6,674,501
Commercial:
Commercial real estate 2,960,383 604 1,655 2,962,642 118,300 3,080,942
Commercial business 314,476 17 354 314,847 9,446 324,293
Total commercial 3,274,859 621 2,009 3,277,489 127,746 3,405,235
Leasing and equipment finance:
Middle market 1,725,252 796 16 1,726,064 9,446 1,735,510
Small ticket 795,881 1,844 518 798,243 3,989 802,232
Winthrop 372,933 22 – 372,955 116 373,071
Other 261,678 64 – 261,742 101 261,843
Total leasing and equipment finance 3,155,744 2,726 534 3,159,004 13,652 3,172,656
Inventory finance 1,565,608 109 10 1,565,727 1,487 1,567,214
Auto finance 550,923 228 304 551,455 101 551,556
Other 26,322 20 11 26,353 1,571 27,924
Subtotal 14,923,896 38,006 57,727 15,019,629 379,457 15,399,086
Portfolios acquired with deteriorated
credit quality 26,348 221 69 26,638 – 26,638
Total $14,950,244 $38,227 $57,796 $15,046,267 $379,457 $15,425,724
At December 31, 2011
(In thousands) Performing
60-89 Days
Delinquent
and Accruing
90 Days or More
Delinquent
and Accruing
Total
Accruing
Non-
Accrual Total
Consumer real estate:
First mortgage lien $ 4,525,951 $ 32,571 $ 54,787 $ 4,613,309 $ 129,114 $ 4,742,423
Junior lien 2,110,334 7,813 14,464 2,132,611 20,257 2,152,868
Total consumer real estate 6,636,285 40,384 69,251 6,745,920 149,371 6,895,291
Commercial:
Commercial real estate 3,092,855 98 1,001 3,093,954 104,744 3,198,698
Commercial business 227,970 49 – 228,019 22,775 250,794
Total commercial 3,320,825 147 1,001 3,321,973 127,519 3,449,492
Leasing and equipment finance:
Middle market 1,627,369 1,260 84 1,628,713 13,185 1,641,898
Small ticket 792,566 2,368 613 795,547 5,535 801,082
Winthrop 447,334 235 – 447,569 1,253 448,822
Other 185,563 198 – 185,761 610 186,371
Total leasing and equipment finance 3,052,832 4,061 697 3,057,590 20,583 3,078,173
Inventory finance 623,717 153 7 623,877 823 624,700
Auto finance – – – – – –
Other 34,829 20 21 34,870 15 34,885
Subtotal 13,668,488 44,765 70,977 13,784,230 298,311 14,082,541
Portfolios acquired with
deteriorated credit quality 65,820 766 1,128 67,714 – 67,714
Total $ 13,734,308 $ 45,531 $ 72,105 $ 13,851,944 $ 298,311 $ 14,150,255
{ 2012 Form 10K } { 73 }