TCF Bank 2012 Annual Report Download - page 39
Download and view the complete annual report
Please find page 39 of the 2012 TCF Bank annual report below. You can navigate through the pages in the report by either clicking on the pages listed below, or by using the keyword search tool below to find specific information within the annual report.-
 1
1 -
2
-
3
-
4
-
5
-
6
-
7
-
8
-
9
-
10
-
11
-
12
-
13
-
14
-
15
-
16
-
17
-
18
-
19
-
20
-
21
-
22
-
23
-
24
-
25
-
26
-
27
-
28
-
 29
29 -
 30
30 -
 31
31 -
 32
32 -
 33
33 -
 34
34 -
 35
35 -
 36
36 -
 37
37 -
 38
38 -
 39
39 -
 40
40 -
 41
41 -
 42
42 -
 43
43 -
 44
44 -
 45
45 -
 46
46 -
 47
47 -
 48
48 -
 49
49 -
50
-
51
-
52
-
53
-
54
-
55
-
56
-
57
-
58
-
59
-
60
-
61
-
62
-
63
-
64
-
65
-
66
-
67
-
68
-
69
-
70
-
71
-
72
-
73
-
74
-
75
-
76
-
77
-
78
-
79
-
80
-
81
-
82
-
83
-
84
-
85
-
86
-
87
-
88
-
89
-
90
-
91
-
92
-
93
-
94
-
95
-
96
-
97
-
98
-
99
-
100
-
101
-
102
-
103
-
104
-
105
-
106
-
107
-
108
-
109
-
110
-
111
-
112
-
113
-
114
-
115
-
116
-
117
-
118
-
119
-
120
-
121
-
122
-
123
-
124
-
125
-
126
-
127
-
128
-
129
-
130
-
131
-
132
-
133
-
134
-
135
-
136
-
137
-
138
-
139
-
140
-
141
-
142
 |
 |
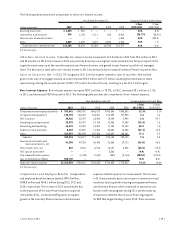
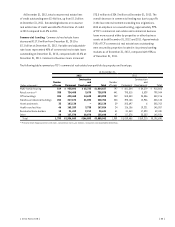
Lending non-interest income totaled $138.5 million in
2012, up 36.8% from $101.2 million for 2011, primarily due
to gains on sales of auto finance and consumer real estate
loans. See Item 7. Management’s Discussion and Analysis —
“Consolidated Income Statement Analysis – Non-Interest
Income” for further discussion.
Lending non-interest expense totaled $367.2 million
for 2012, up 15.3% from $318.4 million for 2011. The
increase was primarily due to the full year impact of the
acquisition and ramp-up of the recently acquired auto
finance business as well as increased staffing levels to
support the new Bombardier Recreational Products, Inc.
(“BRP”) program in inventory finance.
FUNDING–TCF’s funding is primarily derived from branch
banking, consumer and small business deposits, and
treasury investments. With a renewed focus on quality
customer relationships through the introduction of TCF Free
Checking, deposits provide a source of low-cost funds and
fee income. Borrowings may be used to offset reductions in
deposits or to support expanded lending activities. Funding
reported a net loss of $239.1 million for 2012, compared
with net income of $77.5 million in 2011. The net loss in
2012 was due to the balance sheet repositioning completed
in the first quarter of 2012.
Funding net interest income for 2012 was $258.3 million,
up 11.5% from $231.6 million in 2011 primarily related
to the reduced costs of borrowings resulting from the
balance sheet repositioning, partially offset by a reduction
of interest income as a result of lower levels of mortgage
backed securities.
Funding non-interest income totaled $338.9 million in
2012, down 6% from $360.6 million in 2011. The decrease
was primarily due to lower banking fees and revenues related
to changes in our deposit product fee structure and the full-
year effect of the new regulations limiting interchange fees
associated with our debit card transactions.
Funding non-interest expense totaled $969.5 million
in 2012, up from $463.8 million in 2011. The increase was
primarily due to the loss on termination of debt of $550.7
million in the first quarter of 2012 in connection with the
balance sheet repositioning.
SUPPORT SERVICES — TCF’s Support Services segment
consists of the holding company and corporate functions
that provide data processing, bank operations and other
professional services to the operating segments. Support
Services reported a net loss attributable to common
stockholders of $9.9 million and $4.6 million for 2012 and
2011, respectively.
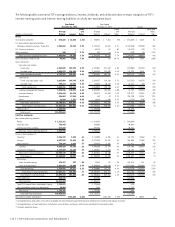
Consolidated Income Statement Analysis
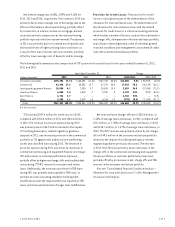
Net Interest Income Net interest income, the difference
between interest earned on loans and leases, investments
and other interest-earning assets (interest income), and
interest paid on deposits and borrowings (interest expense),
represented 61.4% of TCF’s total revenue in 2012, 61.2%
in 2011 and 56.5% in 2010. Net interest income divided by
average interest-earning assets is referred to as the net
interest margin, expressed as a percentage. Net interest
income and net interest margin are affected by changes in
prevailing short- and long-term interest rates, loan and
deposit pricing strategies and competitive conditions, the
volume and the mix of interest-earning assets and interest-
bearing liabilities, the level of non-performing assets, and
the impact of modified loans and leases.
{ 2012 Form 10K } { 23 }