TCF Bank 2012 Annual Report Download - page 49
Download and view the complete annual report
Please find page 49 of the 2012 TCF Bank annual report below. You can navigate through the pages in the report by either clicking on the pages listed below, or by using the keyword search tool below to find specific information within the annual report.-
 1
1 -
2
-
3
-
4
-
5
-
6
-
7
-
8
-
9
-
10
-
11
-
12
-
13
-
14
-
15
-
16
-
17
-
18
-
19
-
20
-
21
-
22
-
23
-
24
-
25
-
26
-
27
-
28
-
29
-
30
-
31
-
32
-
33
-
34
-
35
-
36
-
37
-
38
-
 39
39 -
 40
40 -
 41
41 -
 42
42 -
 43
43 -
 44
44 -
 45
45 -
 46
46 -
 47
47 -
 48
48 -
 49
49 -
 50
50 -
 51
51 -
 52
52 -
 53
53 -
 54
54 -
 55
55 -
 56
56 -
 57
57 -
 58
58 -
 59
59 -
60
-
61
-
62
-
63
-
64
-
65
-
66
-
67
-
68
-
69
-
70
-
71
-
72
-
73
-
74
-
75
-
76
-
77
-
78
-
79
-
80
-
81
-
82
-
83
-
84
-
85
-
86
-
87
-
88
-
89
-
90
-
91
-
92
-
93
-
94
-
95
-
96
-
97
-
98
-
99
-
100
-
101
-
102
-
103
-
104
-
105
-
106
-
107
-
108
-
109
-
110
-
111
-
112
-
113
-
114
-
115
-
116
-
117
-
118
-
119
-
120
-
121
-
122
-
123
-
124
-
125
-
126
-
127
-
128
-
129
-
130
-
131
-
132
-
133
-
134
-
135
-
136
-
137
-
138
-
139
-
140
-
141
-
142
 |
 |

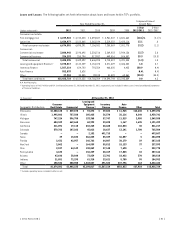
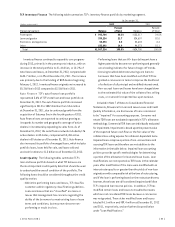
At December 31, 2012, total consumer real estate lines
of credit outstanding were $2.4 billion, up from $2.1 billion
at December 31, 2011. Outstanding balances on consumer
real estate lines of credit were 65.6% of total lines of credit
in 2012 compared to 61.3% in 2011.
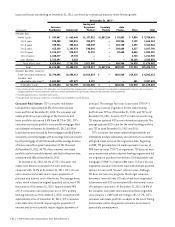
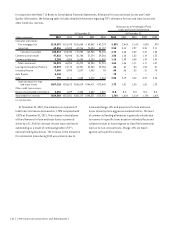
Commercial Lending Commercial real estate loans
decreased $117.8 million from December 31, 2011 to
$3.1 billion at December 31, 2012. Variable and adjustable-
rate loans represented 40% of commercial real estate loans
outstanding at December 31, 2012, compared with 42.4% at
December 31, 2011. Commercial business loans increased
$73.5 million to $324.3 million at December 31, 2012. The
overall decrease in commercial lending was due to payoffs
in the low rate environment exceeding new originations.
With an emphasis on secured lending, approximately 99%
of TCF’s commercial real estate and commercial business
loans were secured either by properties or other business
assets at both December 31, 2012 and 2011. Approximately
91% of TCF’s commercial real estate loans outstanding
were secured by properties located in its primary banking
markets as of December 31, 2012, compared with 93% as
of December 31, 2011.
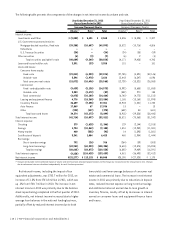
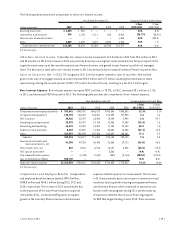
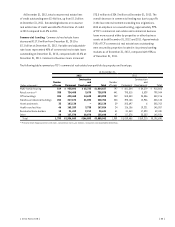
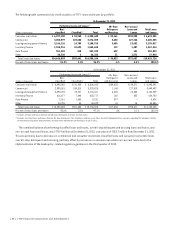
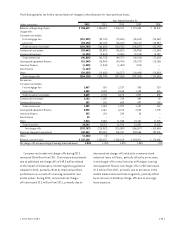
The following table summarizes TCF’s commercial real estate loan portfolio by property and loan type.
At December 31,
2012 2011
(Dollars in thousands)
Number
of Loans Permanent
Construction
and
Development Total
Number
of Loans Permanent
Construction
and
Development Total
Multi-family housing 819 $ 958,892 $ 65,735 $1,024,627 797 $ 861,504 $ 54,379 $ 915,883
Retail services(1) 385 724,408 3,670 728,078 441 793,515 5,529 799,044
Office buildings 204 438,460 14,630 453,090 232 508,330 23,886 532,216
Warehouse/industrial buildings 204 317,673 21,033 338,706 238 395,188 12,946 408,134
Hotels and motels 35 183,138 – 183,138 39 205,697 6 205,703
Health care facilities 46 163,289 3,735 167,024 24 126,136 19,221 145,357
Residential home builders 18 21,419 9,212 30,631 41 31,540 17,890 49,430
Other 88 127,570 28,078 155,648 97 117,578 25,353 142,931
Total 1,799 $2,934,849 $146,093 $3,080,942 1,909 $3,039,488 $159,210 $3,198,698
(1) Primarily retail shopping centers and stores, convenience stores, gas stations, restaurants and automobile dealerships.
{ 2012 Form 10K } { 33 }